Test
StatisticsEnd of unit test
Representing and interpreting data test:Higher
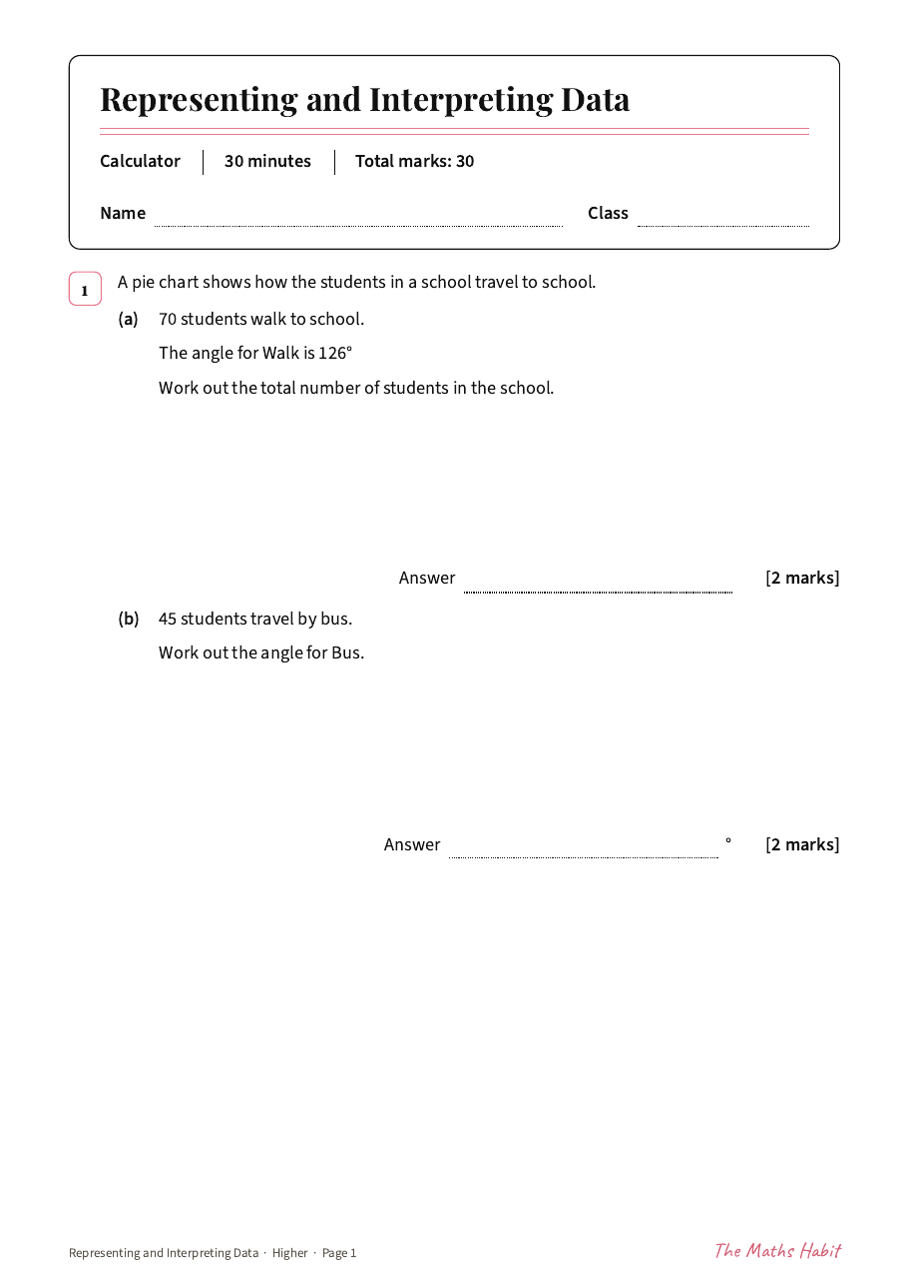
End of unit test, 30 marks, calculator. Pie charts, a scatter graph, cumulative frequency, box plots and histograms with unequal class widths. Answers are drawn on the graphs with every mark shown.
A free GCSE statistics end of unit test with answers, covering spec codes S3, S4 and S6.
Lesson
Scatter graphs
Lesson
Drawing histograms
Lesson
Reading histograms
Lesson
Cumulative frequency graphs
Lesson
Median and quartiles from a graph
Lesson
Box plots
More statistics tests
- Averages and range test: Foundation AEnd of unit test
- Averages and range test: Foundation BEnd of unit test
- Processing and representing data test: Foundation AEnd of unit test
- Processing and representing data test: Foundation BEnd of unit test
- Sampling and averages test: HigherEnd of unit test
- Data and scatter graphs test: Foundation AEnd of unit test
- Data and scatter graphs test: Foundation BEnd of unit test
- Statistics test: CoreEnd of unit test
- Statistics test: ExtensionEnd of unit test