Test
StatisticsEnd of unit test
Data and scatter graphs test:Foundation B
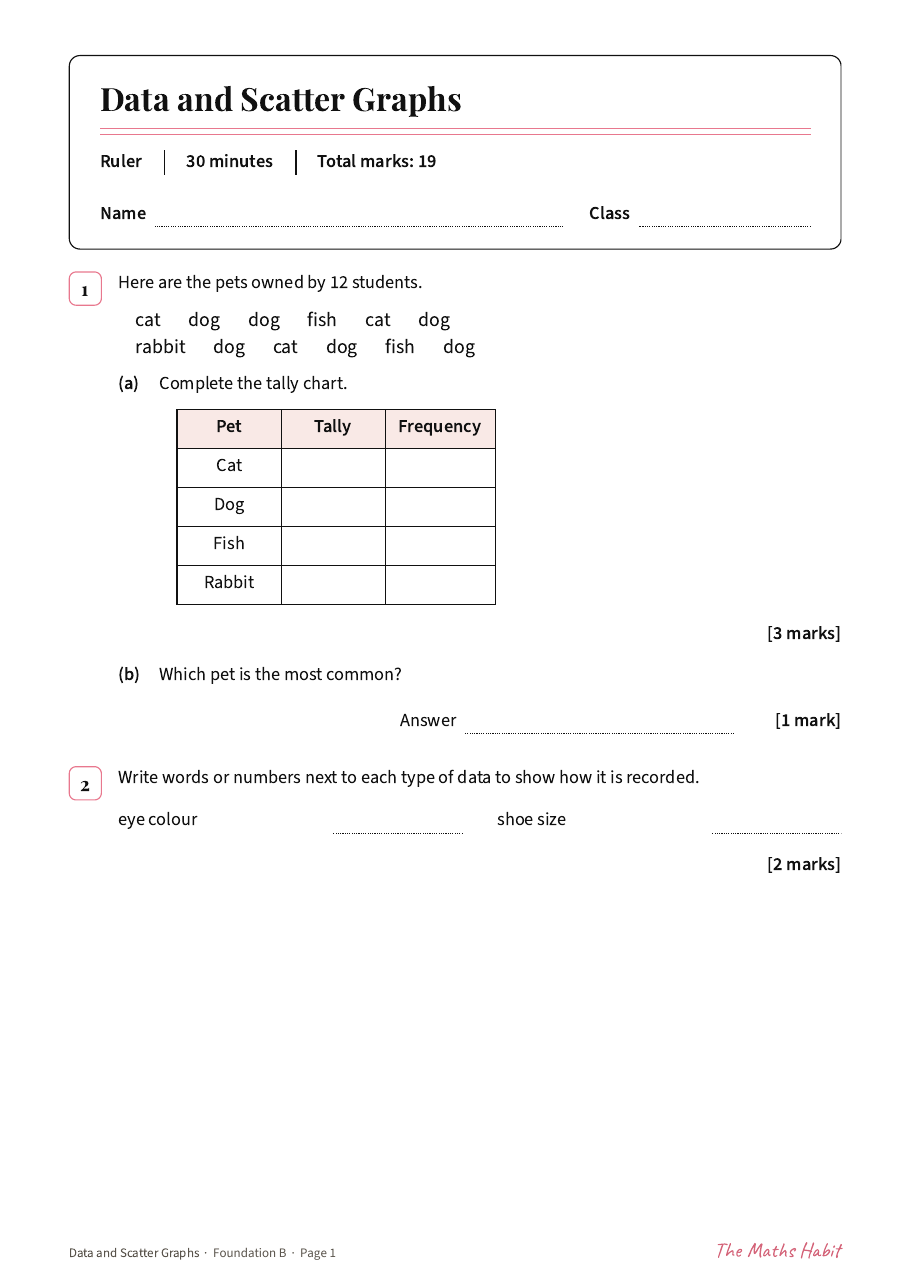
End of unit test, 19 marks. A tally chart, a two way table, a scatter graph to add to, and recognising types of correlation. Answers are written on the paper with every mark shown.
A free GCSE statistics end of unit test with answers, covering spec codes S6 and S1.
Lesson
Two-way tables
More statistics tests
- Averages and range test: Foundation AEnd of unit test
- Averages and range test: Foundation BEnd of unit test
- Processing and representing data test: Foundation AEnd of unit test
- Processing and representing data test: Foundation BEnd of unit test
- Sampling and averages test: HigherEnd of unit test
- Data and scatter graphs test: Foundation AEnd of unit test
- Statistics test: CoreEnd of unit test
- Statistics test: ExtensionEnd of unit test
- Representing and interpreting data test: HigherEnd of unit test