Test
StatisticsEnd of unit test
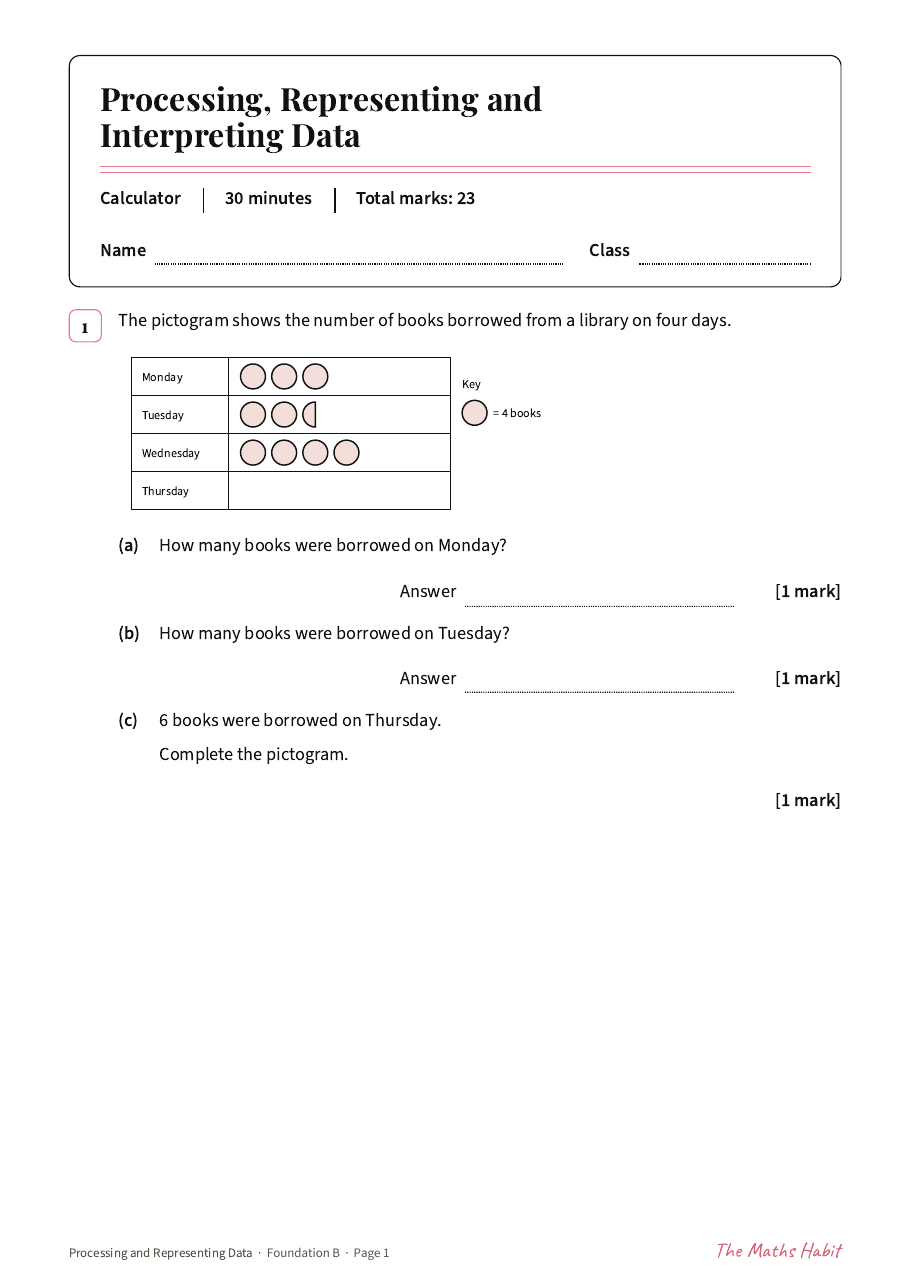
End of unit test, 23 marks. A pictogram, bar charts, a line graph, a time series and pie charts with a table to help. Answers are drawn on the charts with every mark shown.
A free GCSE statistics end of unit test with answers, covering spec code S2.