Lesson deck
StatisticsFoundation
Drawing pie charts
Work out the degrees for each one, fill the angle column, then draw. Every sector has its own pattern as well as colour, so it reads in black and white.
A free key stage 3 and GCSE Foundation statistics lesson on drawing pie charts, spec code S2. It has a lesson deck to teach from with a visualiser, worksheets with answers, a puzzle, an exit ticket, an end of unit test and a method video.
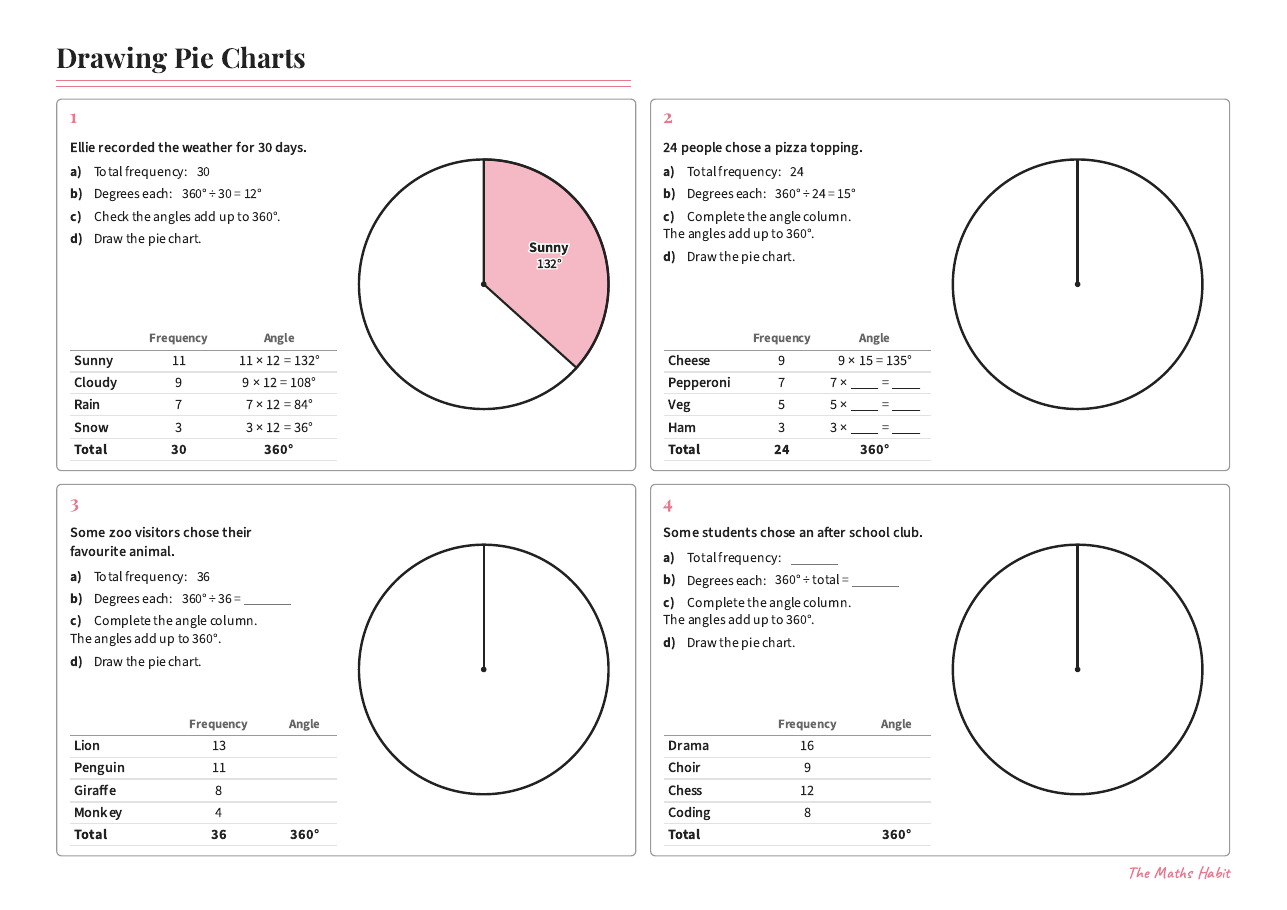
Foundation
Drawing pie charts
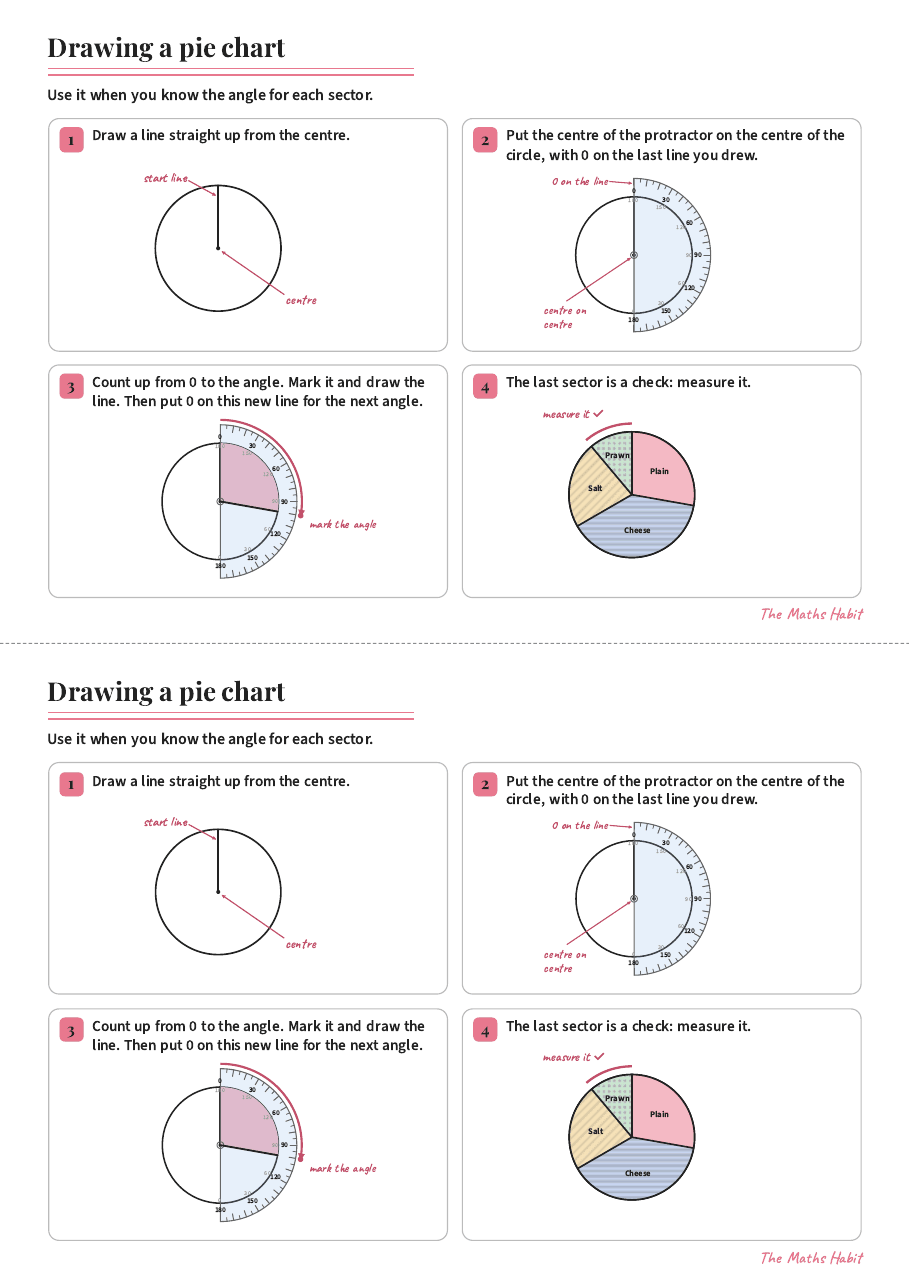
Foundation
Drawing a pie chart
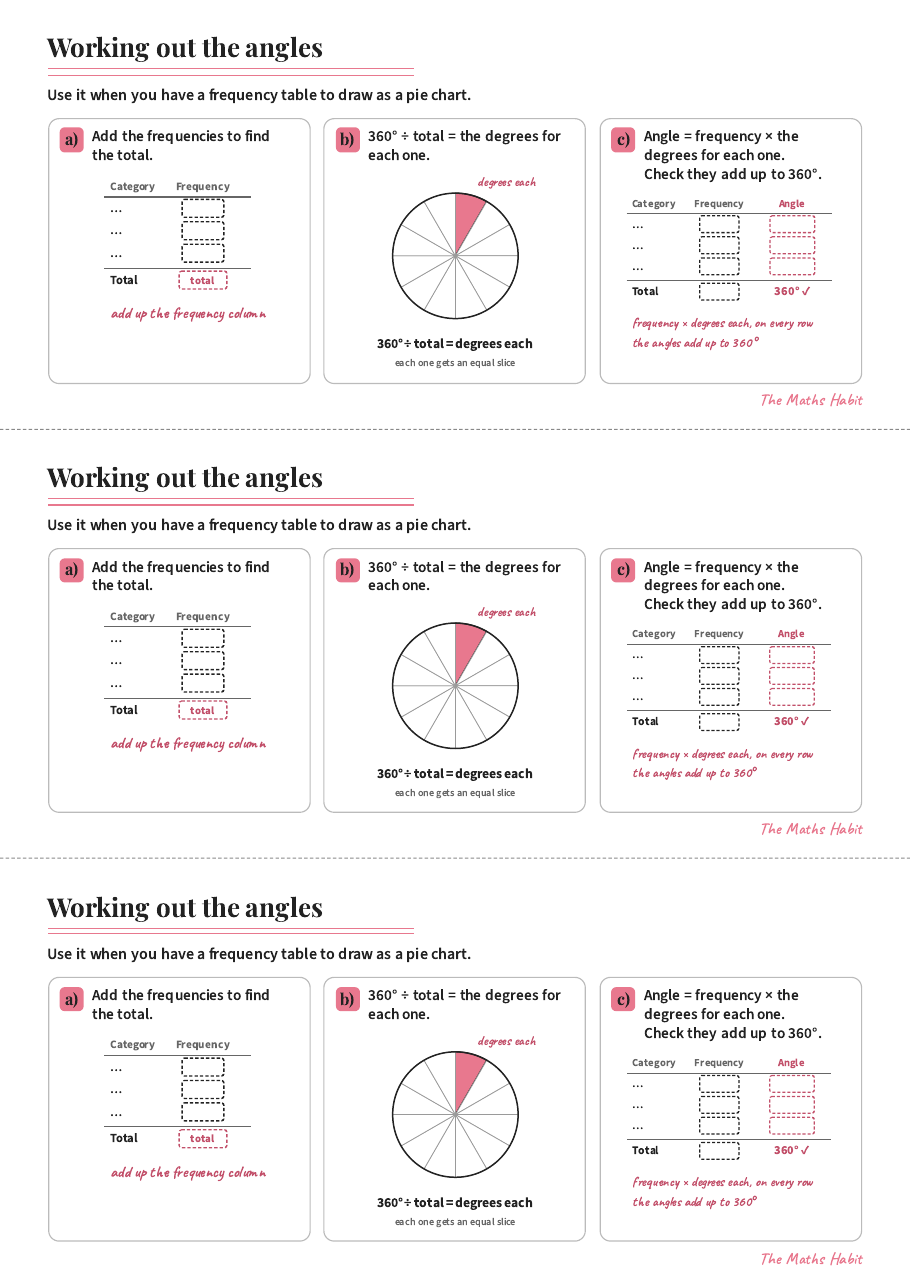
Foundation
Working out the angles for a pie chart
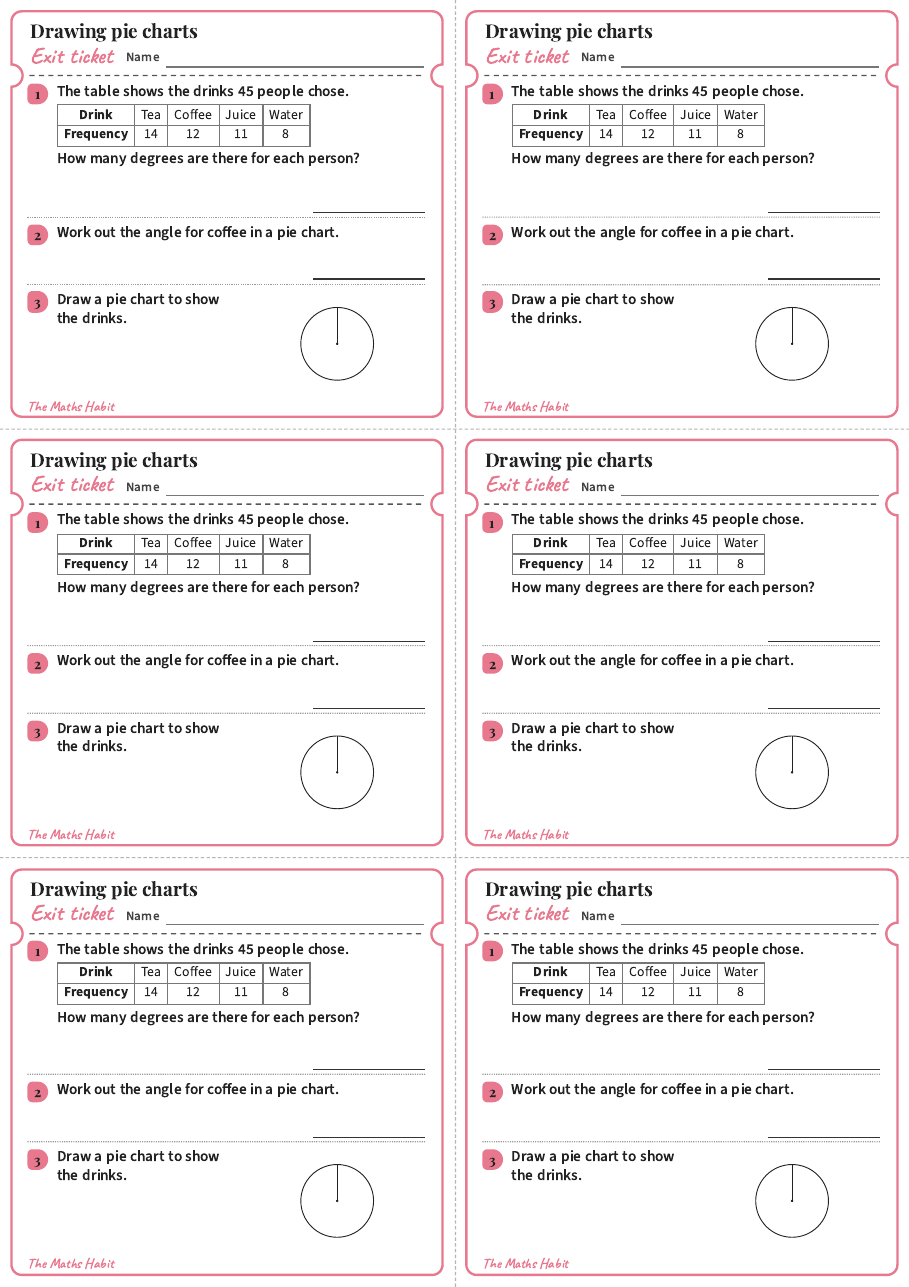
Exit ticket
Drawing pie charts
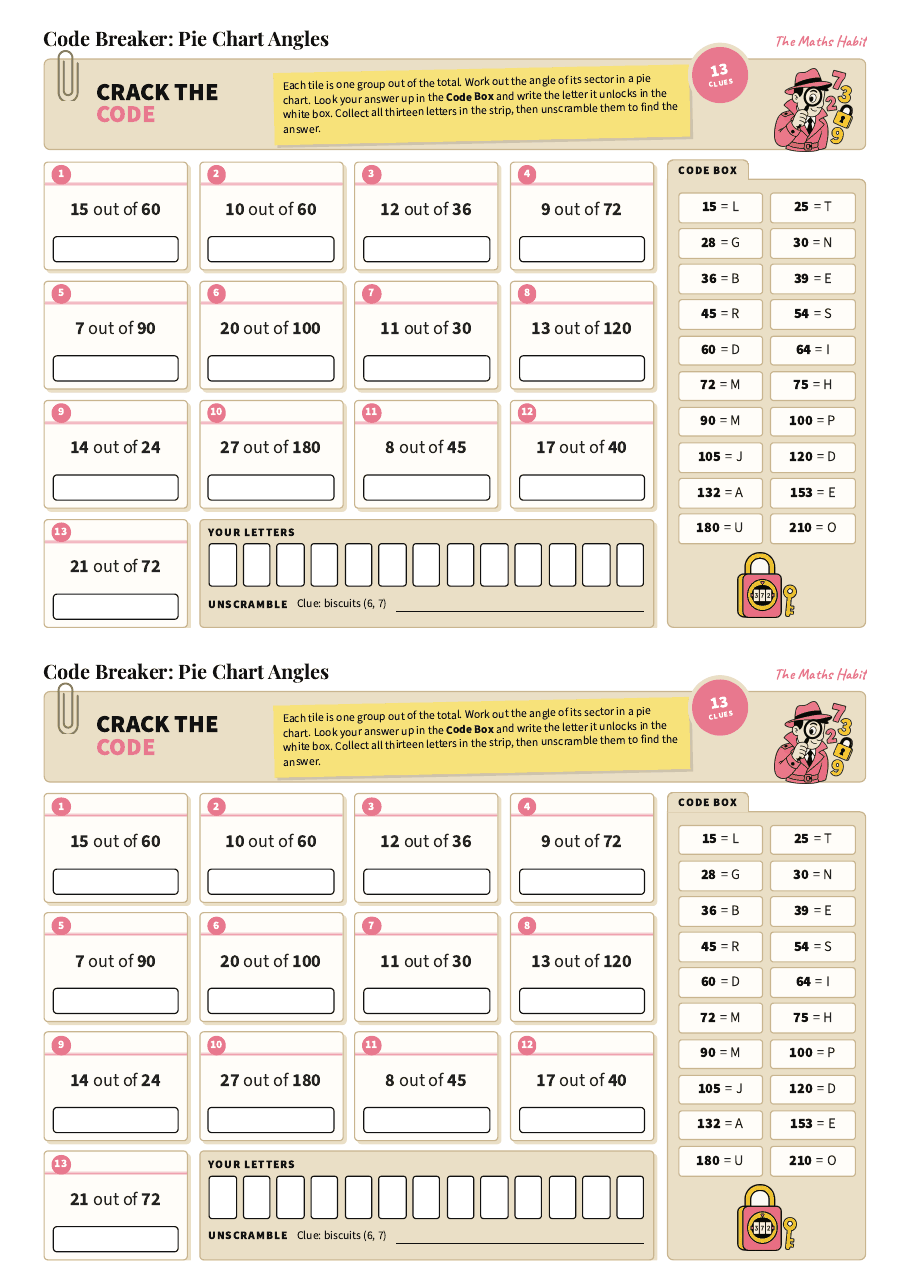
Puzzle
Code breaker:Pie chart angles
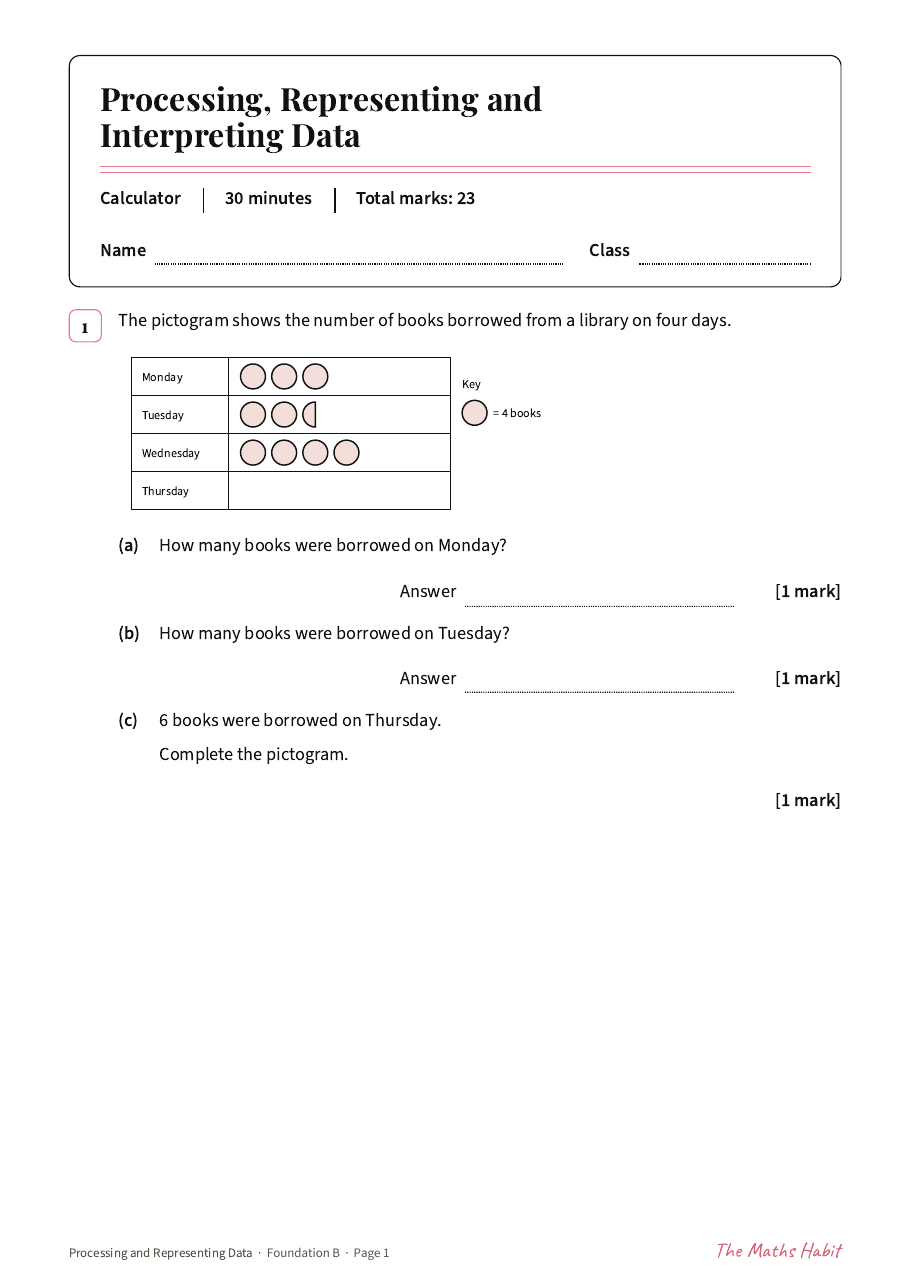
Test
Processing and representing data test:Foundation B
Method video
Pie charts
More in Statistics
- Two-way tablesLesson · Foundation
- Bar chartsLesson · Support
- Reading bar charts and pictogramsLesson · Support
- Bar chartsLesson · Foundation
- Comparative and composite bar chartsLesson · Foundation
- Line graphsLesson · Common
- Stem-and-leaf diagramsLesson · Foundation
- Median, mode and rangeLesson · Support
- The meanLesson · Support
- Mode and rangeLesson · Support
- Code breaker: two-way tablesPuzzle
- Revision mat: probability, Foundation BRevision mat · Foundation
- Revision mat: probability, Foundation ARevision mat · Foundation
- Revision mat: probability, Higher ARevision mat · Higher