Test
StatisticsEnd of unit test
Statistics test:Core
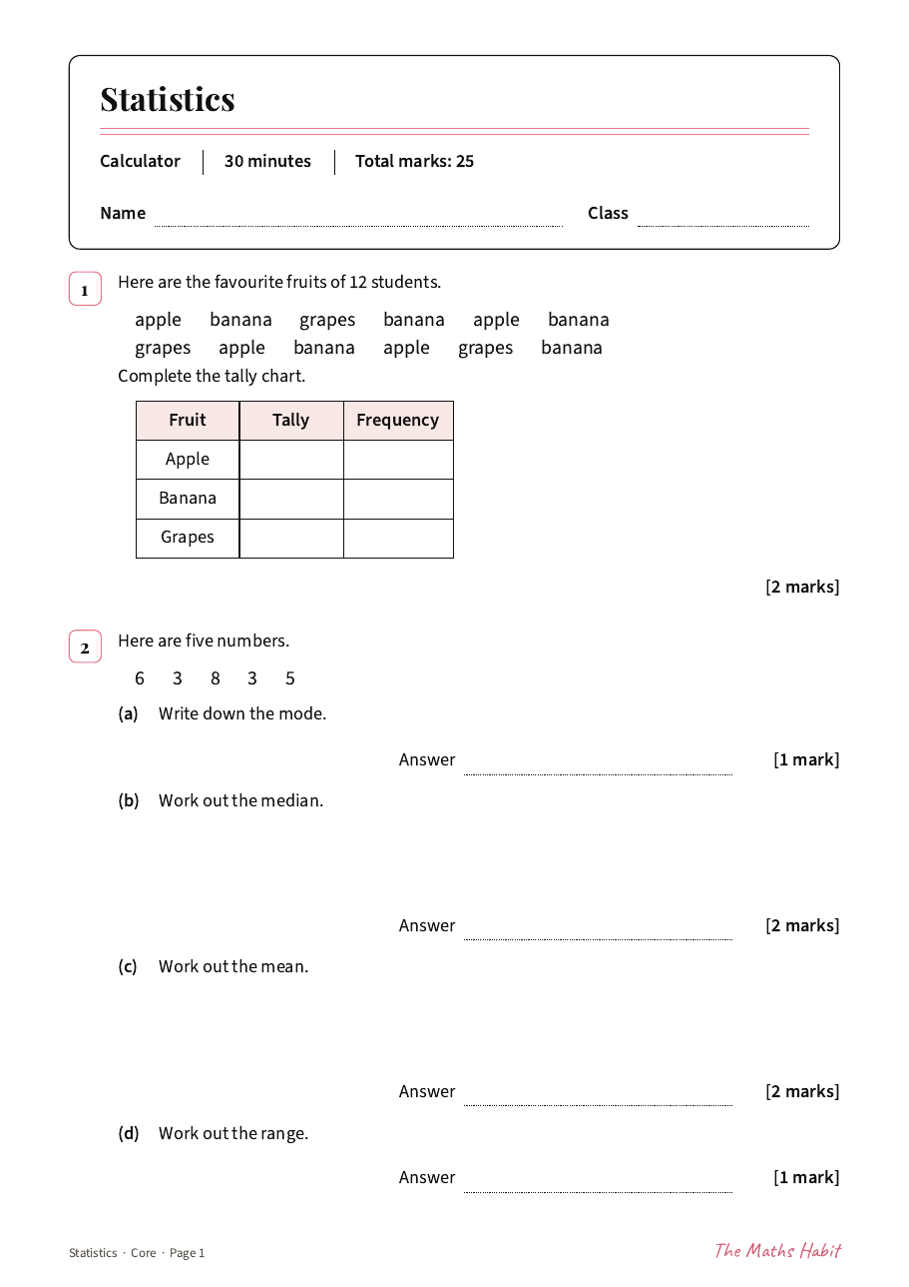
End of unit test, 25 marks. A tally chart, averages and range, a pictogram, a bar chart, a pie chart, a two way table and a frequency table. Answers are written on the paper with every mark shown.
A free key stage 3 statistics end of unit test with answers, covering spec codes S2 and S4.
More statistics tests
- Averages and range test: Foundation AEnd of unit test
- Averages and range test: Foundation BEnd of unit test
- Processing and representing data test: Foundation AEnd of unit test
- Processing and representing data test: Foundation BEnd of unit test
- Sampling and averages test: HigherEnd of unit test
- Data and scatter graphs test: Foundation AEnd of unit test
- Data and scatter graphs test: Foundation BEnd of unit test
- Statistics test: ExtensionEnd of unit test
- Representing and interpreting data test: HigherEnd of unit test