Higher
StatisticsWorksheet · Higher
Histograms:Which step breaks?
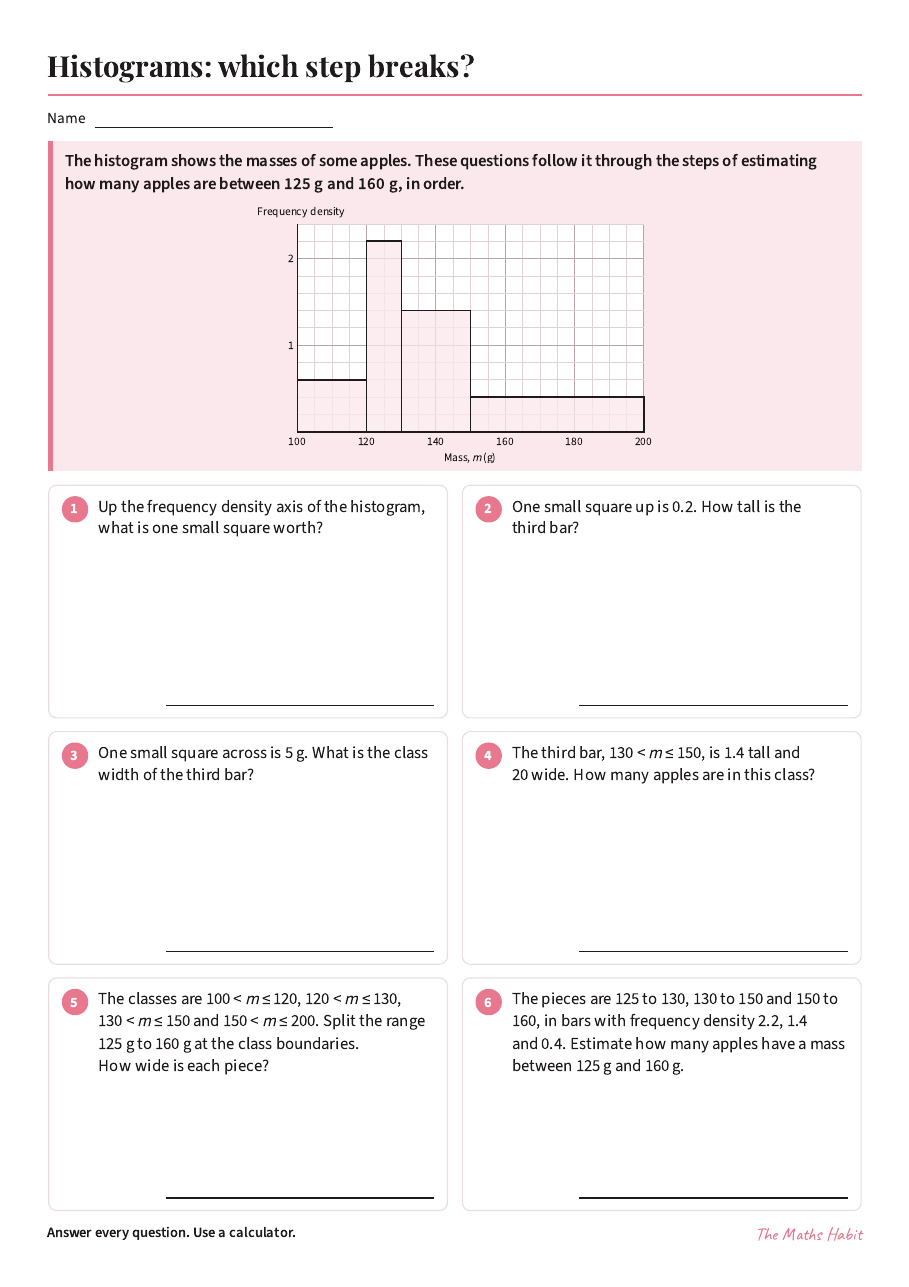
Six questions that follow one histogram through each step of estimating how many values lie between two values, with no examples on the page. The first one wrong is the step that breaks, and the answers name its fix it card.
A free GCSE Higher statistics worksheet with answers, spec code S3. It goes with the lessons on drawing histograms and reading histograms.
Lesson
Drawing histograms
Lesson
Reading histograms
More in Statistics
- Two-way tablesLesson · Support
- Two-way tablesLesson · Foundation
- Drawing pie charts with simple anglesLesson · Support
- Drawing pie chartsLesson · Support
- Drawing pie chartsLesson · Foundation
- Bar chartsLesson · Support
- Reading bar charts and pictogramsLesson · Support
- Bar chartsLesson · Foundation
- Comparative and composite bar chartsLesson · Support
- Comparative and composite bar chartsLesson · Foundation
- Code breaker: two-way tablesPuzzle
- Revision mat: probability, SupportRevision mat · Foundation
- Revision mat: probability, CoreRevision mat · Foundation
- Revision mat: probability, StretchRevision mat · Higher