Lesson deck
StatisticsSupport
Drawing pie charts with simple angles
Every angle is 30°, 60°, 90°, 120° or 180°. A circle with its start line on every question: find the total, the degrees each and the angle column, then draw, with the frame printed until the last questions of the further practice.
A free key stage 3 and GCSE support statistics lesson on drawing pie charts with simple angles, spec code S2. It has a lesson deck to teach from with a visualiser, worksheets with answers, an exit ticket and an end of unit test.
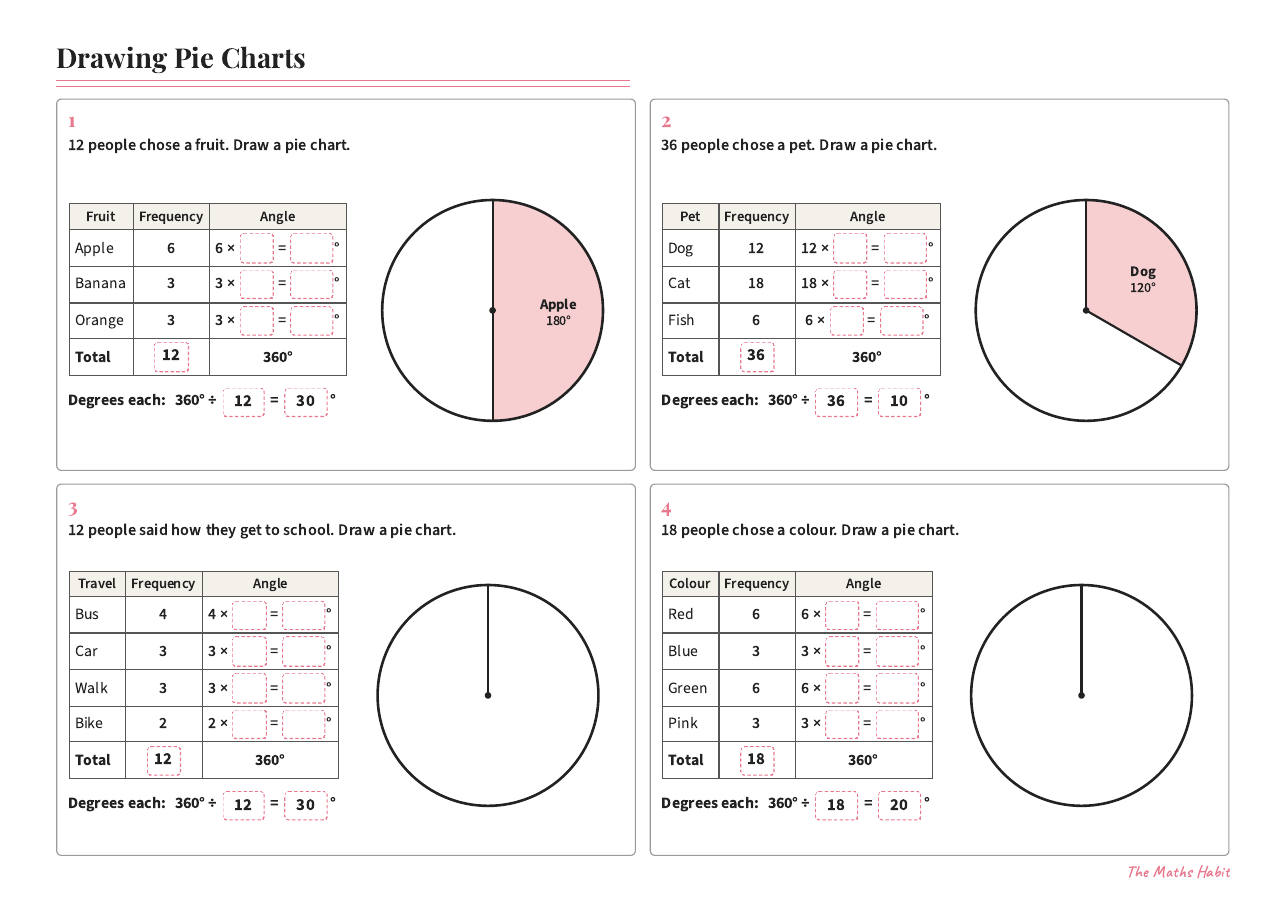
Support
Drawing pie charts with simple angles
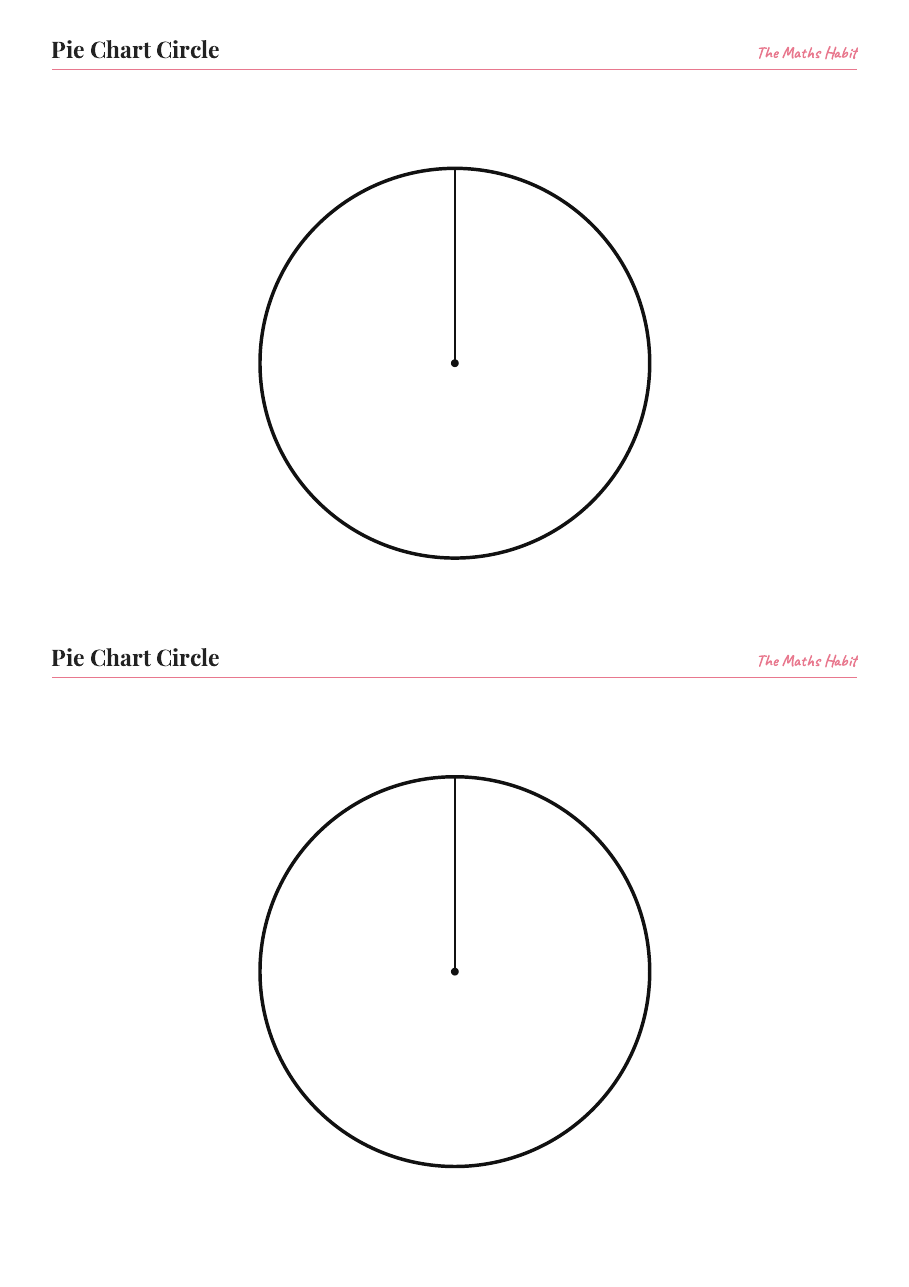
Printable
Pie chart circles
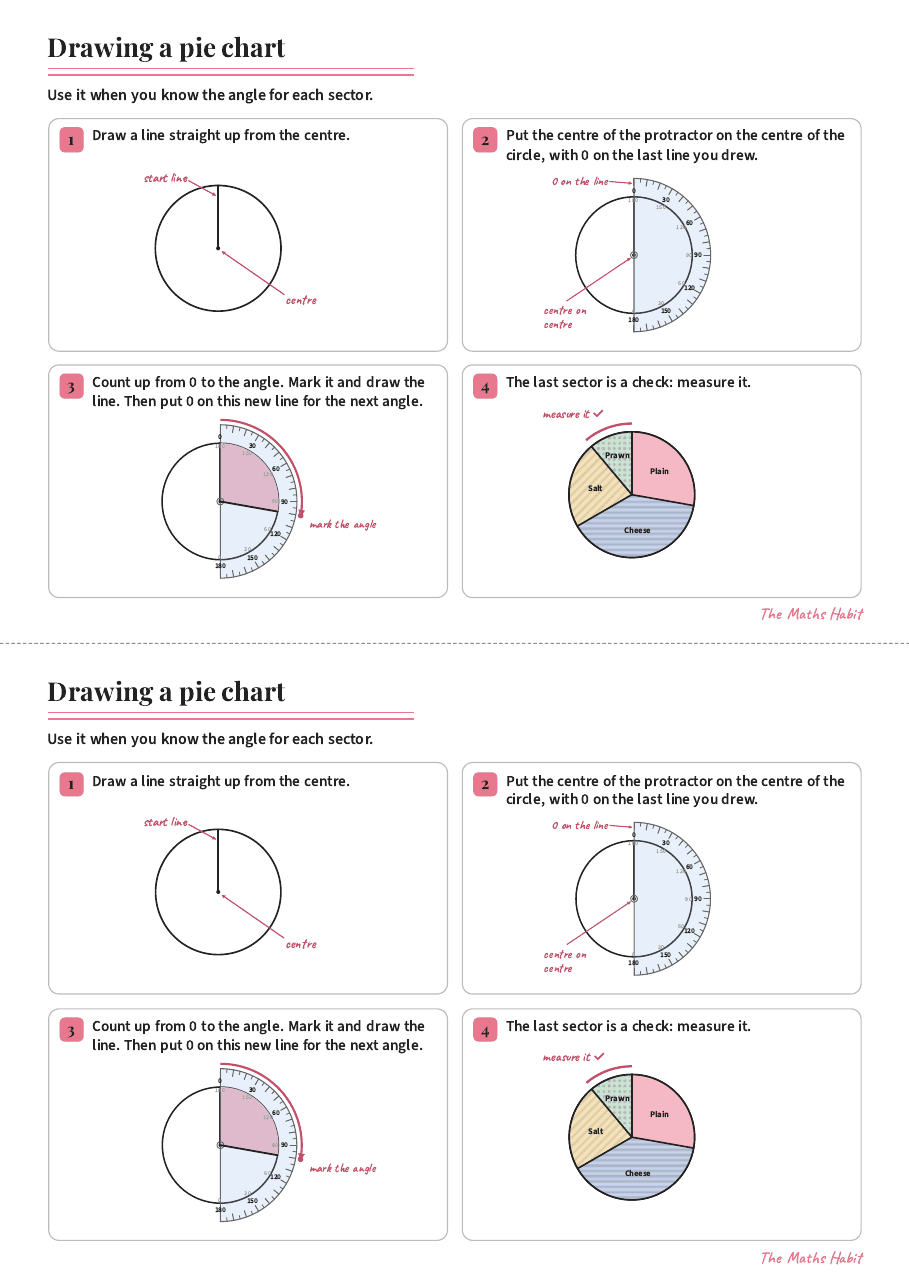
Foundation
Drawing a pie chart
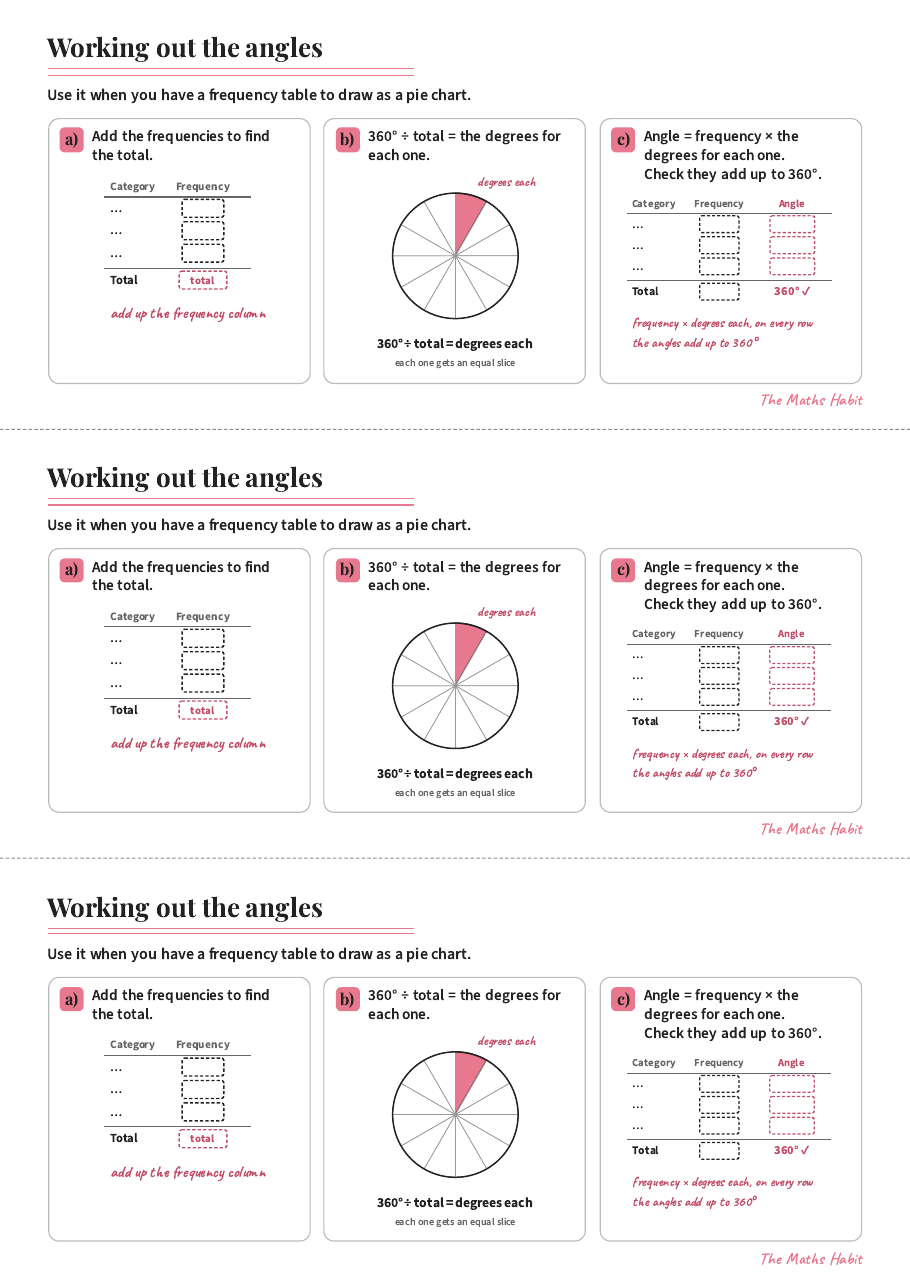
Foundation
Working out the angles for a pie chart
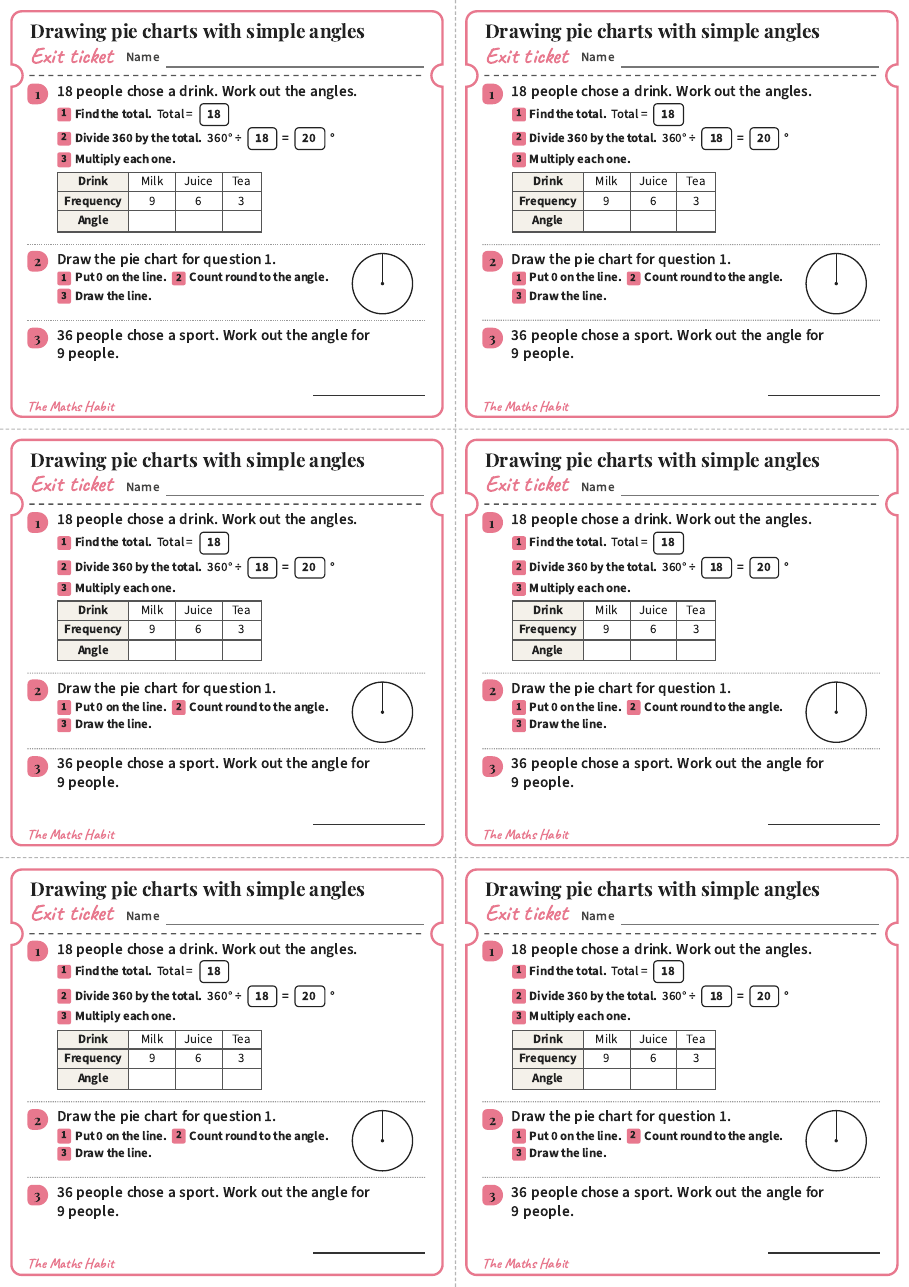
Exit ticket
Drawing pie charts with simple angles
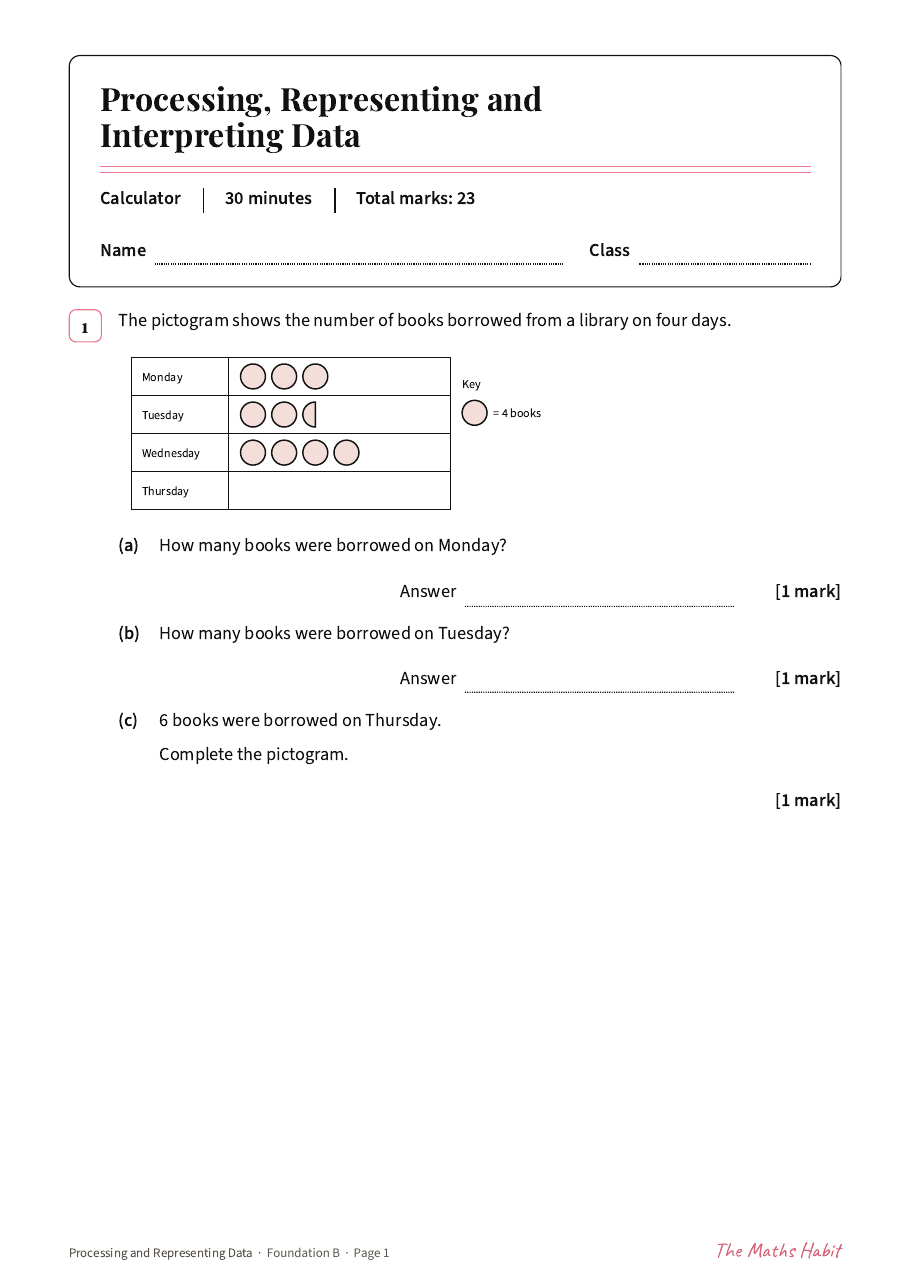
Test
Processing and representing data test:Support
More in Statistics
- Two-way tablesLesson · Support
- Two-way tablesLesson · Foundation
- Drawing pie chartsLesson · Support
- Drawing pie chartsLesson · Foundation
- Bar chartsLesson · Support
- Reading bar charts and pictogramsLesson · Support
- Bar chartsLesson · Foundation
- Comparative and composite bar chartsLesson · Support
- Comparative and composite bar chartsLesson · Foundation
- Line graphsLesson · Common
- Code breaker: two-way tablesPuzzle
- Revision mat: probability, SupportRevision mat · Foundation
- Revision mat: probability, CoreRevision mat · Foundation
- Revision mat: probability, StretchRevision mat · Higher