Lesson deck
StatisticsSupport
Drawing pie charts
A circle with its start line on every question. Find the total, the degrees each and the angle column, then draw, with the frame printed until the last questions of the further practice.
A free key stage 3 and GCSE support statistics lesson on drawing pie charts, spec code S2. It has a lesson deck to teach from with a visualiser, worksheets with answers, an exit ticket and an end of unit test.
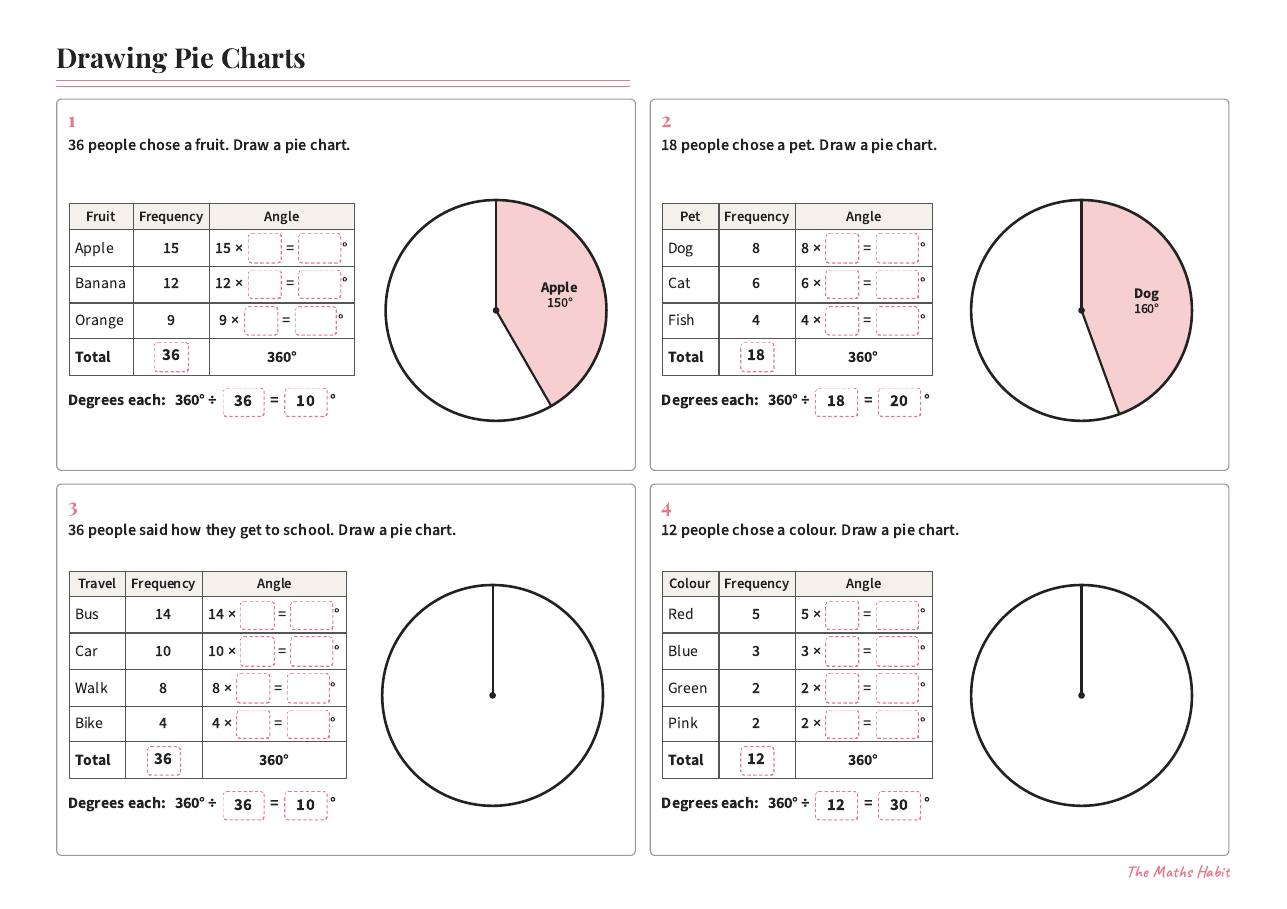
Support
Drawing pie charts
Printable
Pie chart circles
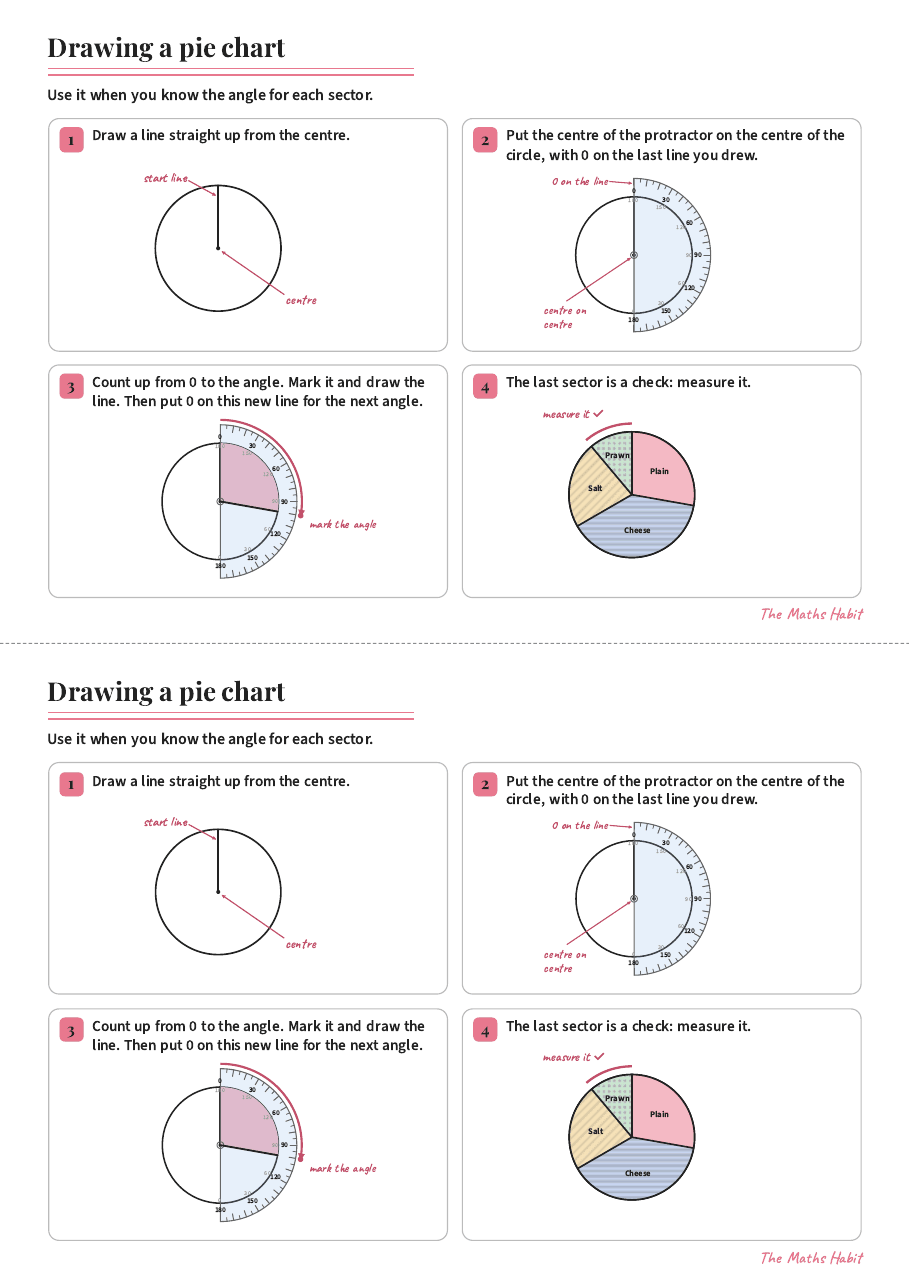
Foundation
Drawing a pie chart
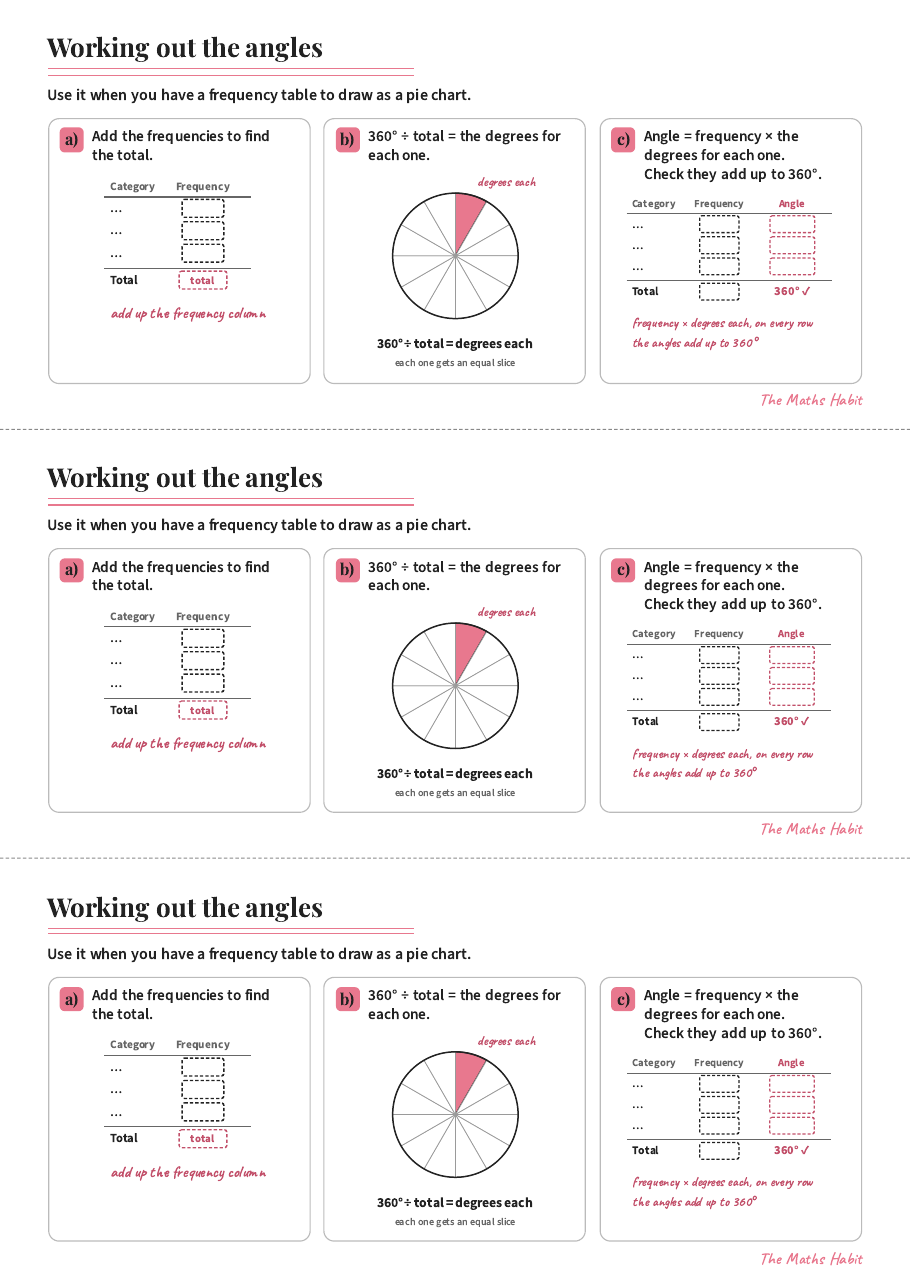
Foundation
Working out the angles for a pie chart
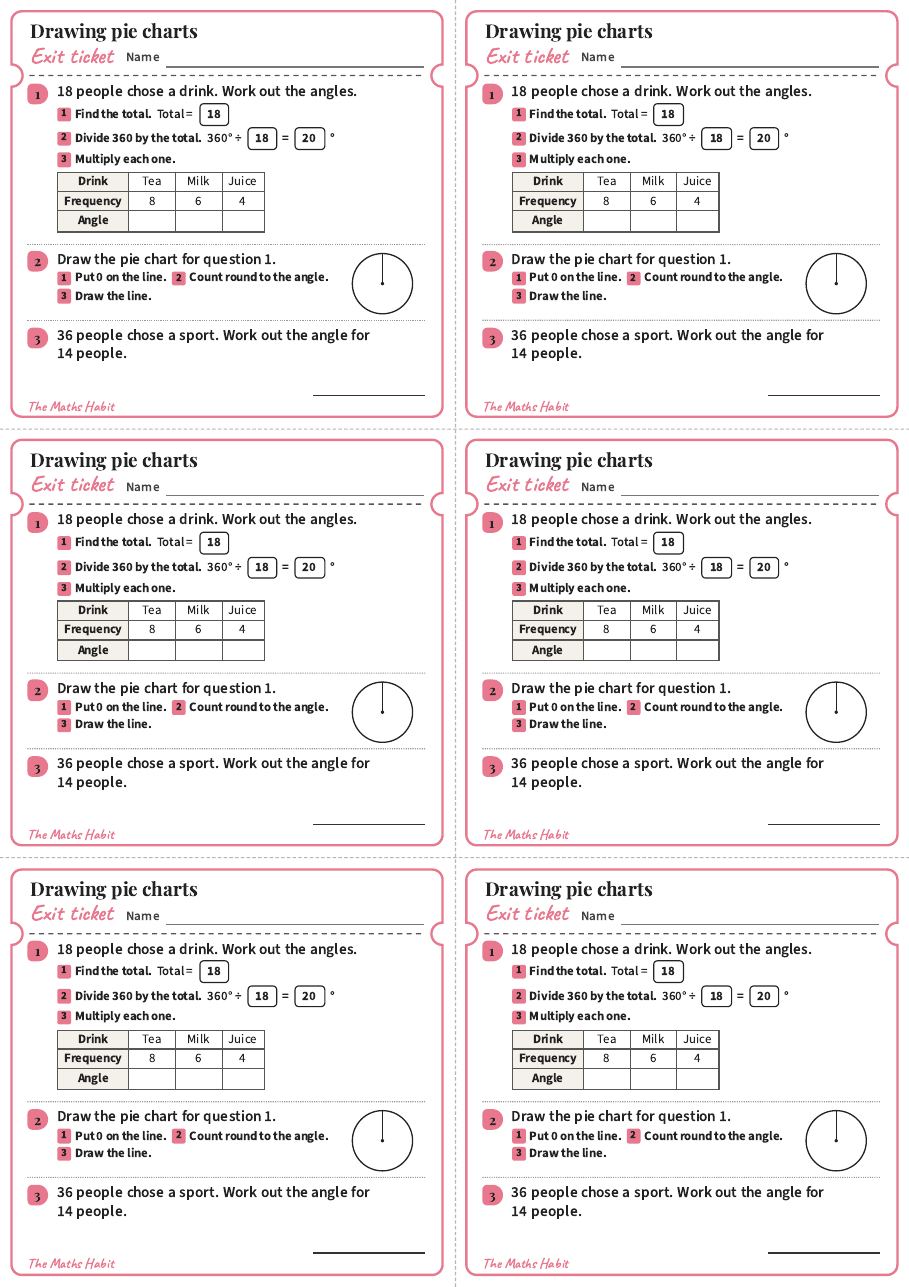
Exit ticket
Drawing pie charts
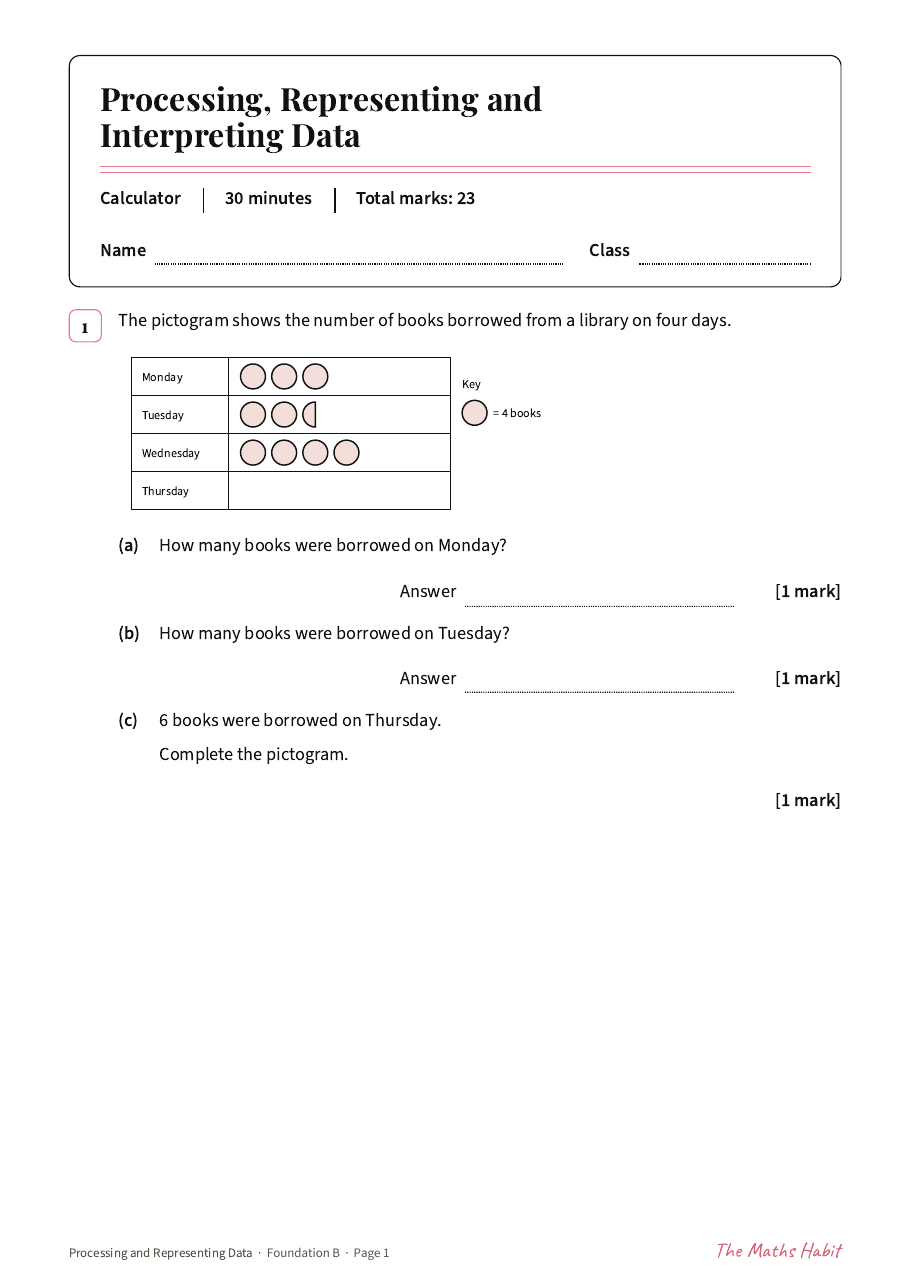
Test
Processing and representing data test:Foundation B
More in Statistics
- Two-way tablesLesson · Support
- Two-way tablesLesson · Foundation
- Drawing pie chartsLesson · Foundation
- Bar chartsLesson · Support
- Reading bar charts and pictogramsLesson · Support
- Bar chartsLesson · Foundation
- Comparative and composite bar chartsLesson · Support
- Comparative and composite bar chartsLesson · Foundation
- Line graphsLesson · Common
- Stem-and-leaf diagramsLesson · Support
- Code breaker: two-way tablesPuzzle
- Revision mat: probability, Foundation BRevision mat · Foundation
- Revision mat: probability, Foundation ARevision mat · Foundation
- Revision mat: probability, Higher ARevision mat · Higher