Puzzle
StatisticsPuzzle
Four Fours:Choosing the best average
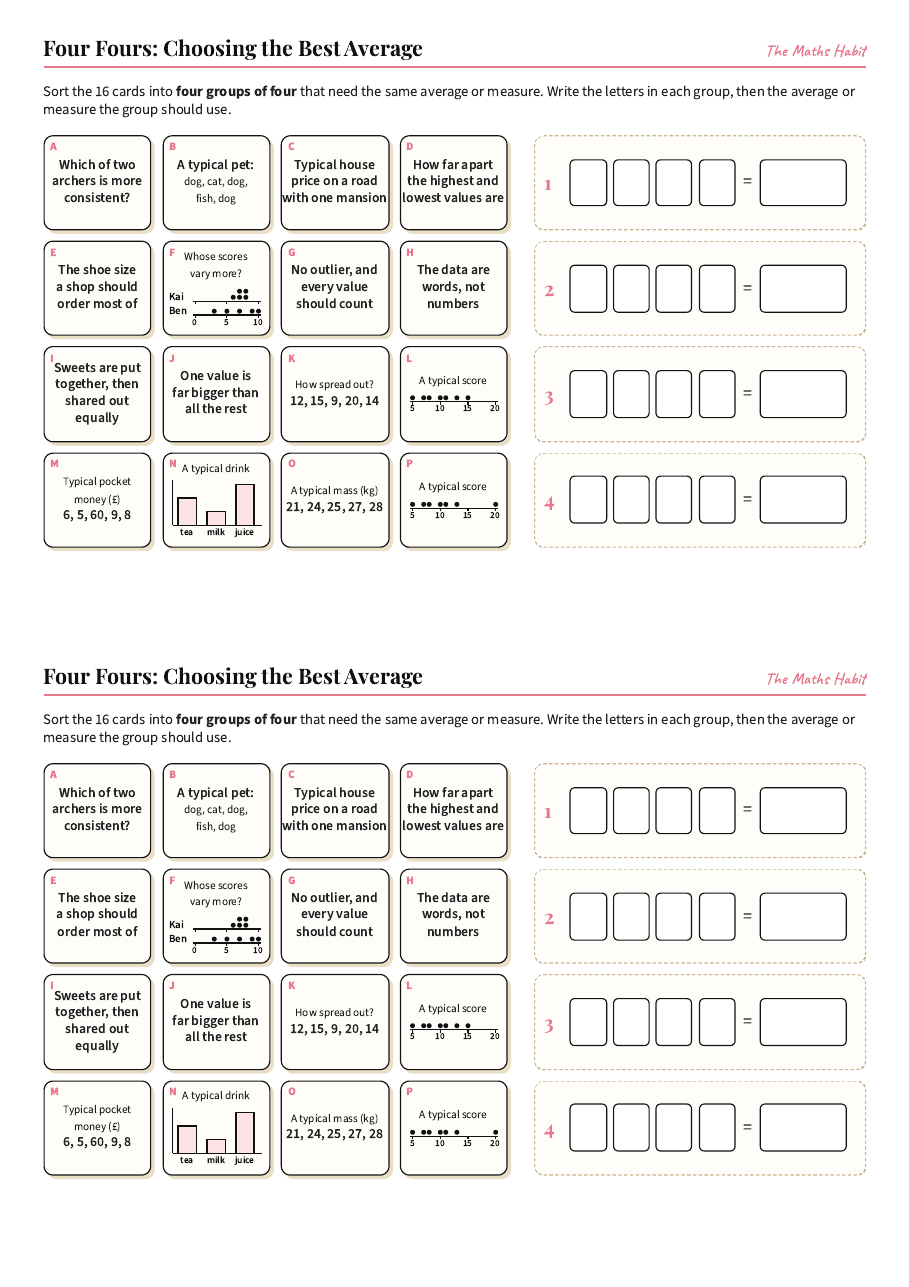
Sixteen situations, lists and small charts sorted by what should describe them: the mode, the median, the mean or the range. Two dot plots differ by one value, and that outlier changes the answer from the mean to the median. Two per A4.
A free key stage 3 and GCSE statistics puzzle with answers, spec code S5. It goes with the lesson on choosing the best average.
Lesson
Choosing the best average
More in Statistics
- Two-way tablesLesson · Foundation
- Drawing pie chartsLesson · Foundation
- Bar chartsLesson · Support
- Reading bar charts and pictogramsLesson · Support
- Bar chartsLesson · Foundation
- Comparative and composite bar chartsLesson · Foundation
- Line graphsLesson · Common
- Stem-and-leaf diagramsLesson · Foundation
- Median, mode and rangeLesson · Support
- The meanLesson · Support
- Code breaker: two-way tablesPuzzle
- Revision mat: probability, Foundation BRevision mat · Foundation
- Revision mat: probability, Foundation ARevision mat · Foundation
- Revision mat: probability, Higher ARevision mat · Higher