Higher
StatisticsRevision mat · Higher
Revision mat:Representing and interpreting data, Higher A
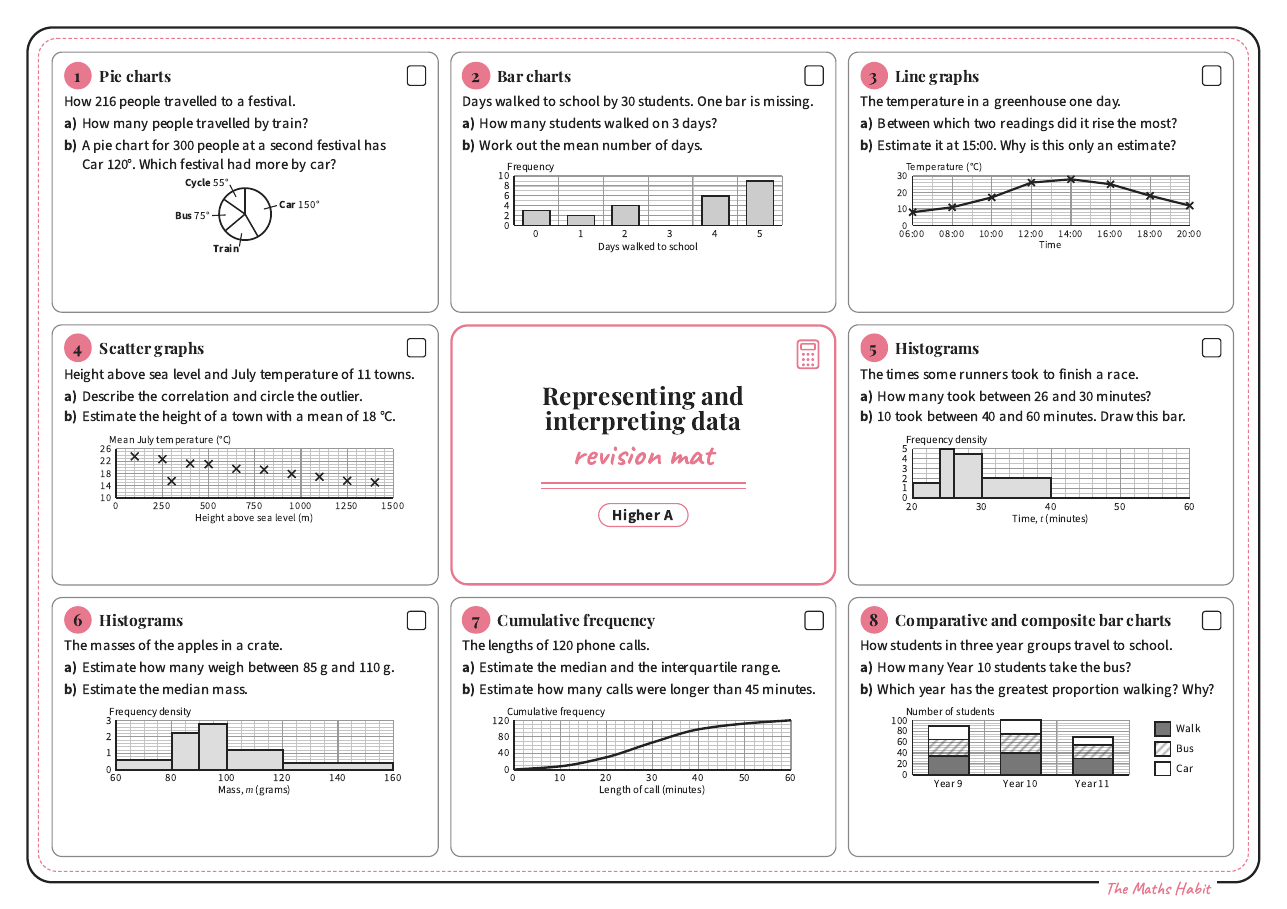
One page to revise the unit: pie charts, bar charts, line graphs, scatter graphs, histograms, cumulative frequency and composite bar charts. Students tick each box when they get it right.
A free GCSE Higher statistics revision mat with answers, spec codes S2, S3 and S6.
More in Statistics
- Two-way tablesLesson · Foundation
- Drawing pie chartsLesson · Foundation
- Bar chartsLesson · Support
- Reading bar charts and pictogramsLesson · Support
- Bar chartsLesson · Foundation
- Comparative and composite bar chartsLesson · Foundation
- Line graphsLesson · Common
- Stem-and-leaf diagramsLesson · Foundation
- Median, mode and rangeLesson · Support
- The meanLesson · Support
- Code breaker: two-way tablesPuzzle
- Revision mat: probability, Foundation BRevision mat · Foundation
- Revision mat: probability, Foundation ARevision mat · Foundation
- Revision mat: probability, Higher ARevision mat · Higher