Puzzle
StatisticsPuzzle
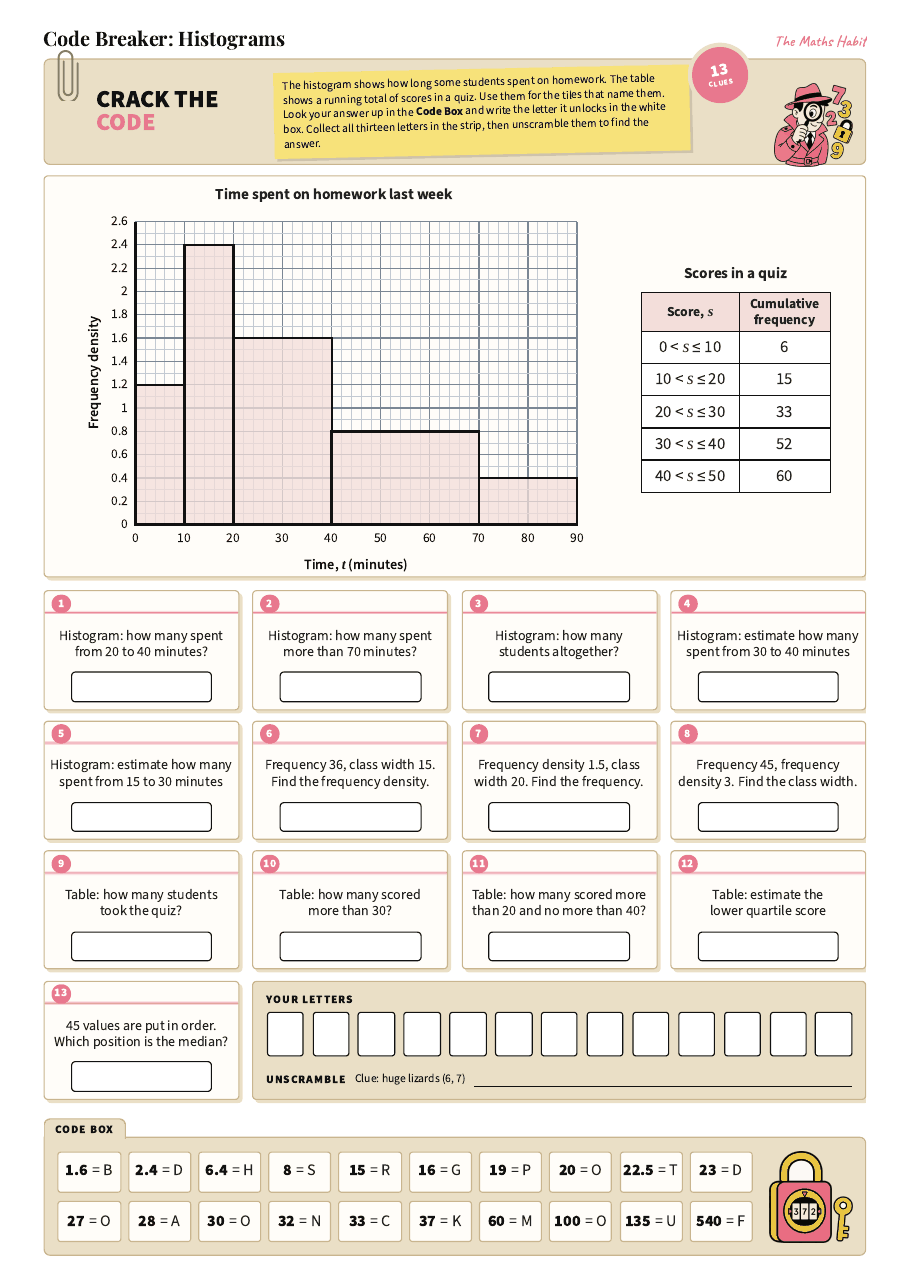
A histogram with unequal class widths and a cumulative frequency table above thirteen tiles: frequencies from the areas of the bars, estimates for part of a class, frequency density and class width, then running totals, the lower quartile and the position of the median. The Code Box includes the answers you get by reading the height of a bar as its frequency. One per A4.
A free GCSE statistics puzzle with answers, spec code S3. It goes with the lessons on drawing histograms, reading histograms, cumulative frequency graphs and median and quartiles from a graph.