Lesson deck
AlgebraFoundation
Plotting quadratic graphs
Complete the table of values, plot the points and join them with a smooth curve, then write down the lowest point. Four to a page so there is room to draw. Starts with y = x squared and ends with an x term.
A free key stage 3 and GCSE Foundation algebra lesson on plotting quadratic graphs, spec code A12. It has a lesson deck to teach from with a visualiser, a worksheet with answers, a puzzle, an exit ticket and end of unit tests.
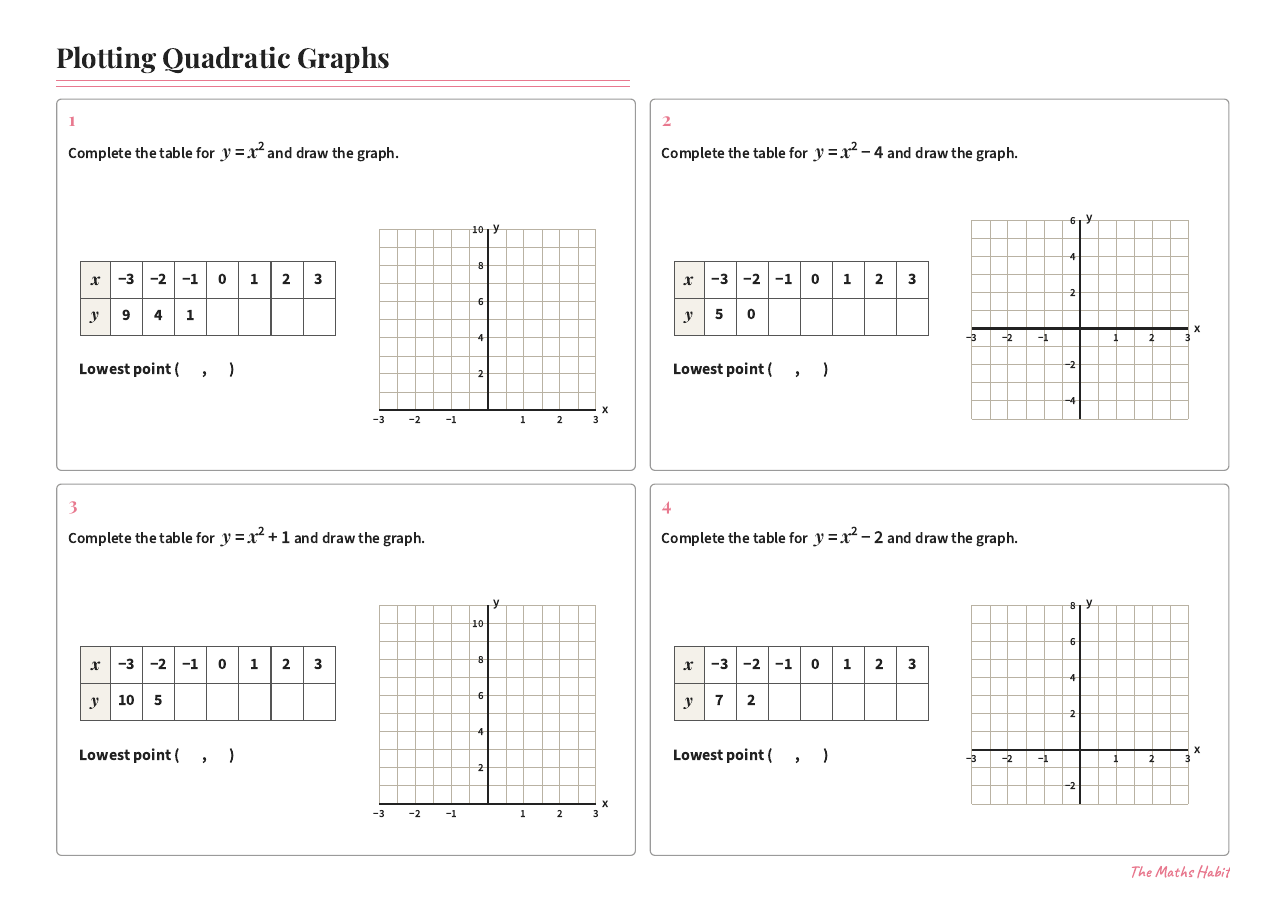
Foundation
Plotting quadratic graphs
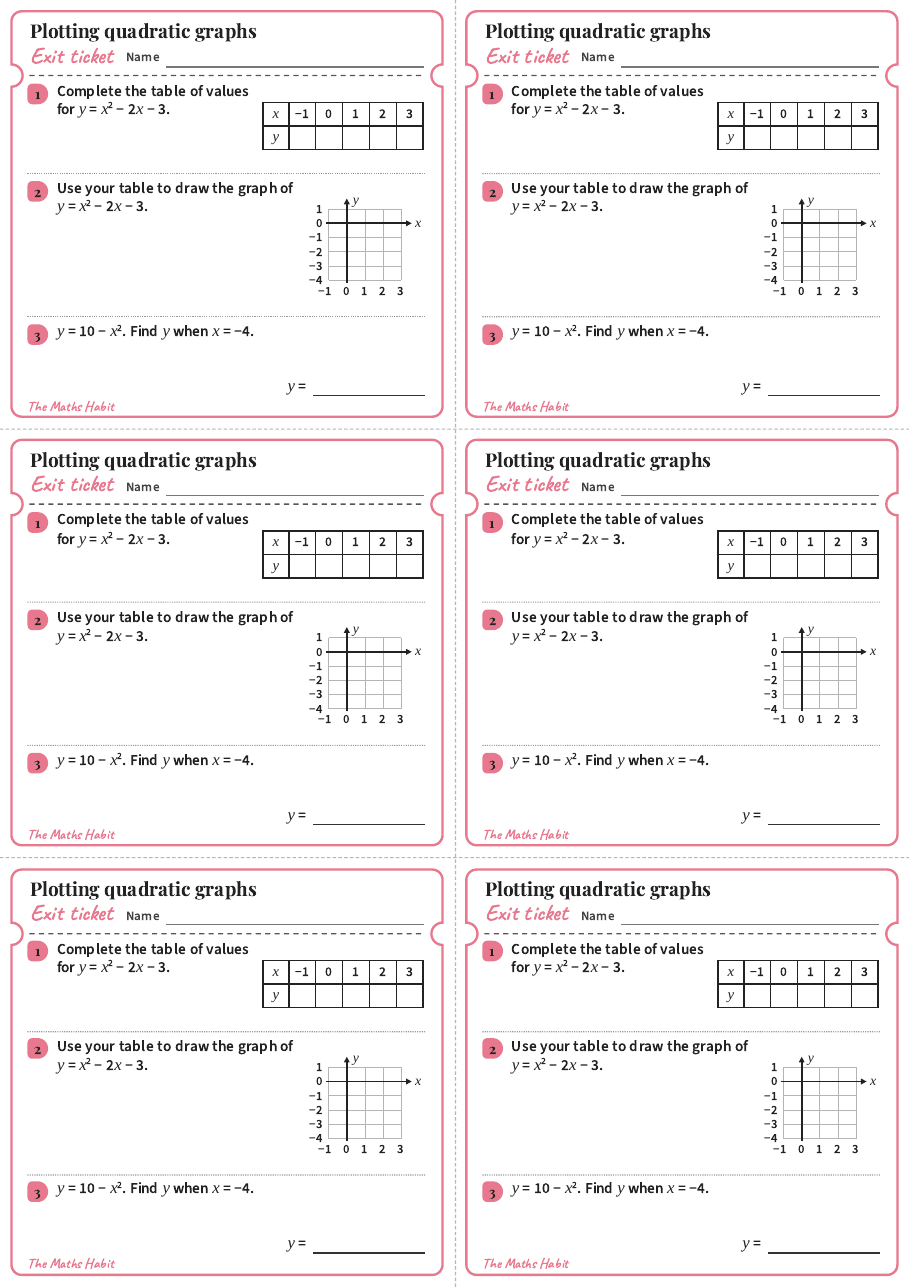
Exit ticket
Plotting quadratic graphs
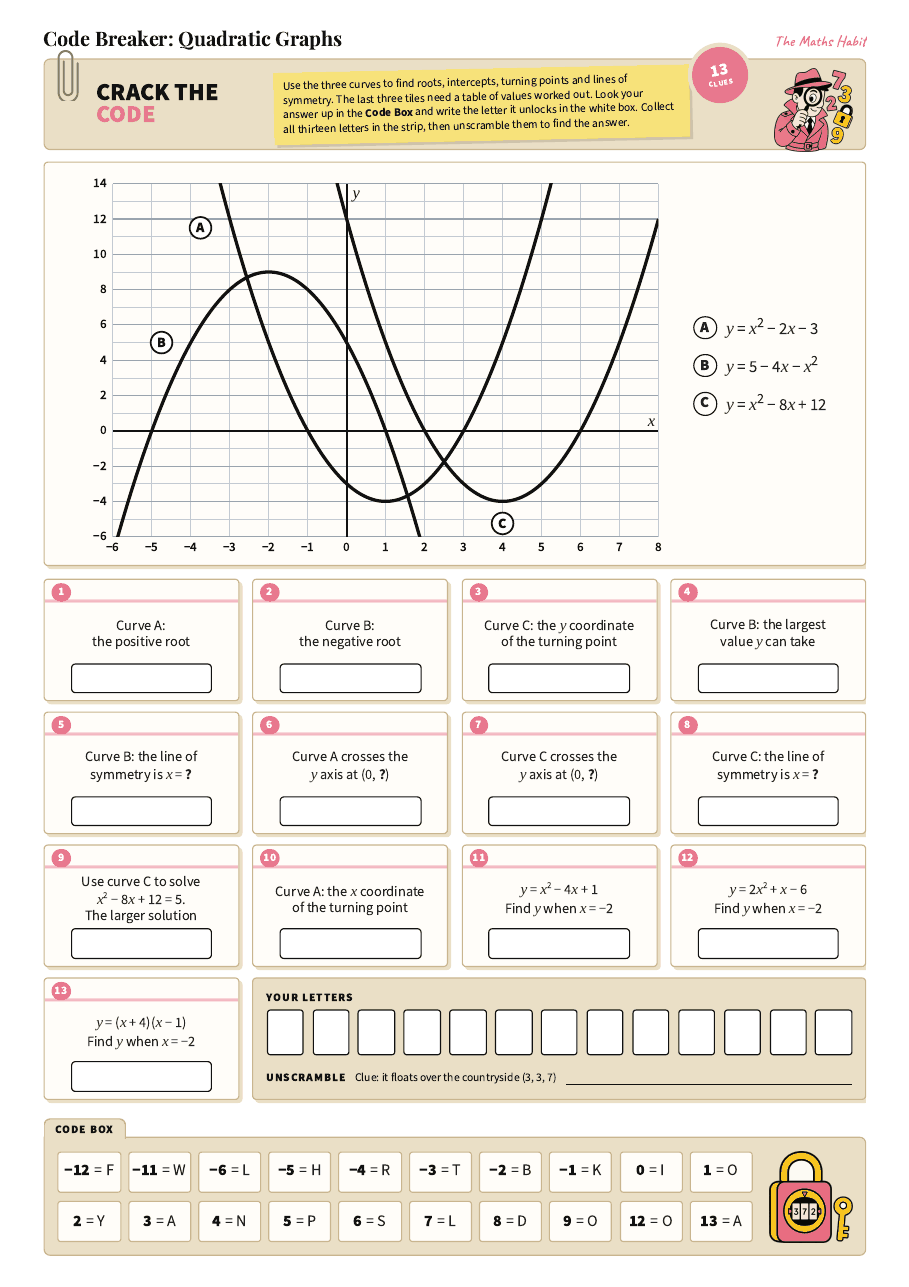
Puzzle
Code breaker:Quadratic graphs
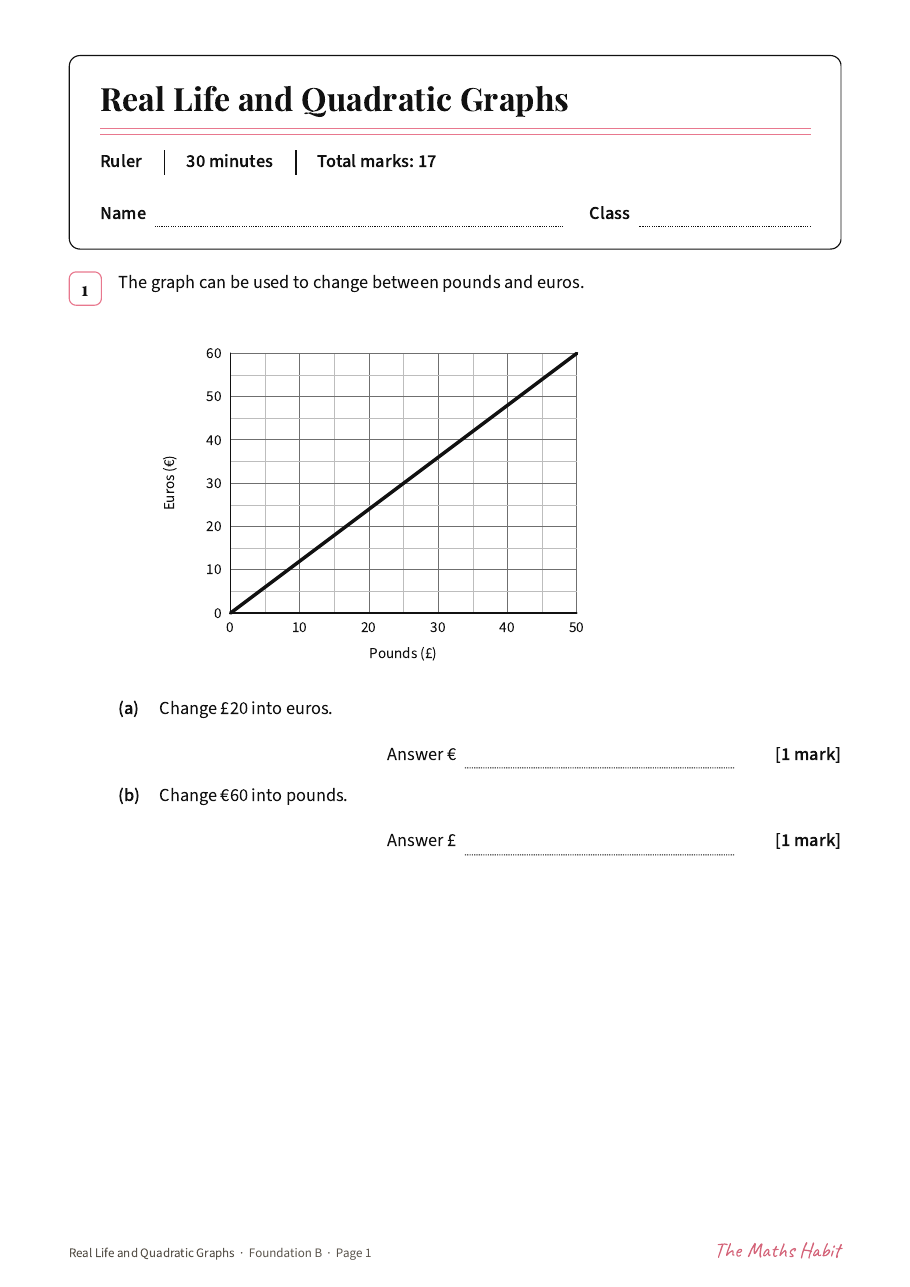
Test
Real life and quadratic graphs test:Foundation B
Test
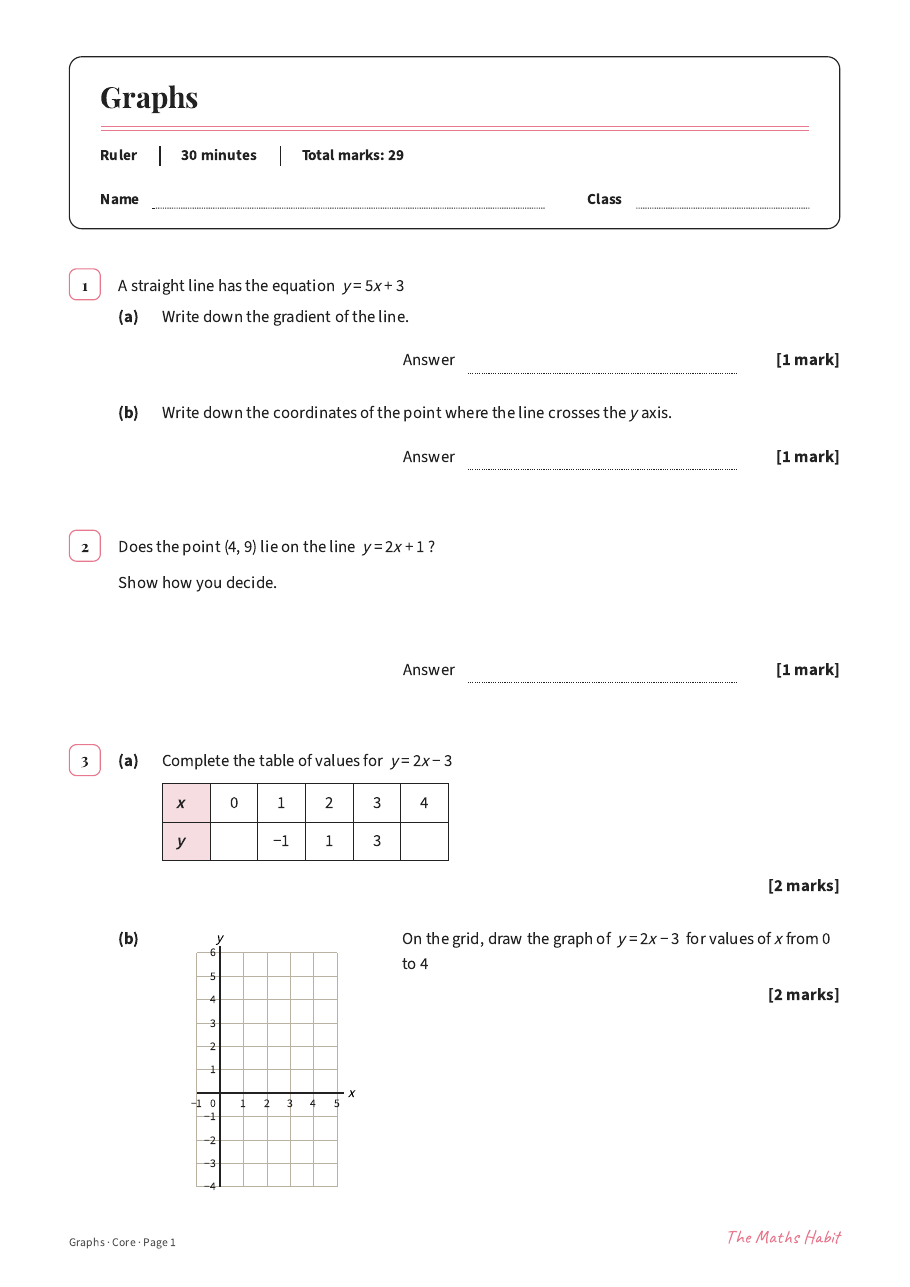
Graphs test:Core
More in Graphs
- Completing the squareLesson · Higher
- CoordinatesLesson · Support
- Coordinates in the first quadrantLesson · Support
- CoordinatesLesson · Foundation
- Plotting straight-line graphsLesson · Support
- Plotting straight-line graphsLesson · Foundation
- Gradient of a lineLesson · Foundation
- The equation of a line from its graphLesson · Foundation
- Perpendicular linesLesson · Higher
- Conversion graphsLesson · Support
- Simultaneous equations: exam questionsExam questions
- Completing the squareWorksheet · Higher
- Mystery picture: coordinatesPuzzle
- Mystery picture: first quadrantPuzzle